I answered the First one that was making this table. I'm stuck after. 1 Year Population...
I answered the First one that was making this table. I'm stuck after.
1
|
Year |
Population |
|
2000 |
6 x 10⁹ |
|
2050 |
12 x 109 = 1.2 x 10¹⁰ |
|
2100 |
24 x 109 = 2.4 x 10¹⁰ |
|
2150 |
48 x 109 =4.8 x 10¹⁰ |
|
2200 |
96 x 109 = 9.6 x10¹⁰ |
|
2250 |
192 x 109 = 1.92 x 10¹¹ |
|
2300 |
384 x 109 = 3.84 x 10¹¹ |
|
2350 |
768 x 109 = 7.68 x 10¹¹ |
|
2400 |
1536 x 109 = 1.536 x 10¹² |
|
2450 |
3072 x 109 = 3.072 x10¹² |
|
2500 |
6144 x 109 = 6.144 x 10¹² |
|
2550 |
12288 x 109 = 1.2288 x 10¹³ |
|
2600 |
24576 x 109 = 2.4576 x 10¹³ |
|
2650 |
49152 x 109 = 4.9152 x 10¹³ |
|
2700 |
98304 x 109 = 9.8304 x 10¹³ |
|
2750 |
196608 x 109 = 1.96608 x 10¹⁴ |
|
2800 |
393216 x 109 = 3.93216 x 10¹⁴ |
|
2850 |
786432 x 109 = 7.86432 x 10¹⁴ |
|
2900 |
1572864 x 109 = 1.572864 x 10¹⁵ |
|
2950 |
3145728 x 109 = 3.145728 x 10¹⁵ |
|
3000 |
6291456 x 109 = 6.291656 x 10¹⁵ |
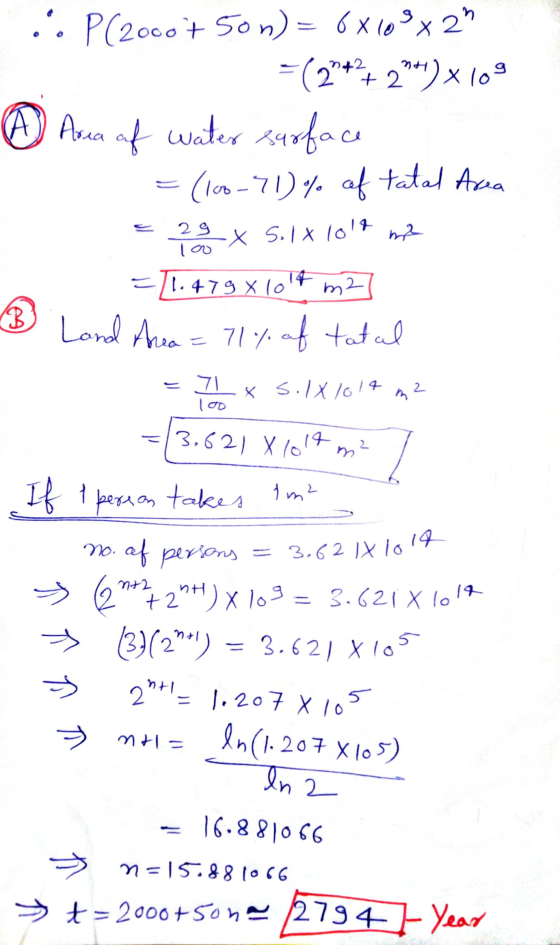
- Approximately 71% of the Earth’s surface is water. The total surface area of the Earth is approximately 5.1 x 10¹⁴ m2. PART A: How many square meters of the Earth’s surface is not water? Show your work. Don’t round. Write your answer using scientific notation. PART B: Assuming that people could occupy only the land part of the Earth, approximately when would people be so crowded that every person would have only 1 m2 of space? Refer to the table you created in question 1 to answer this. Provide an approximate year.
- Suppose that, when we take into account the area needed to grow food and to find other resources, each person actually requires about 10,000 m2 of area to survive. About when (using the table from question 1) would we reach this limit? Use your answer from #2, PART A to help with this one because we are assuming that we can only live and grow food on land. Show your work. Provide an approximate year.
- Suppose that we learn to colonize other planets and moons in our solar system. The total surface area of the worlds in our solar system that could potentially be colonized (not counting gas planets such as Jupiter) is roughly 5 times the total surface area of the Earth,
5(5.1 x 10¹⁴)=2.55 x 10¹⁵ m2 including all of the surfaces covered by water. Could humanity fit in our solar system in the year 3000, assuming each person needs 1 m2 of space? Explain with complete sentences. Use the table you created in question 1 to help you answer this.
5. Input the table into the graphing calculator or the online calculator. If using a graphing calculator, turn on plot 1. Use ZoomStat to view the scatter plot of this data.
Sketch a picture or insert an image of what you see on the calculator or on the screen.
6. Use a graphing calculator or online resource to determine the linear regression equation for this data. Write the equation of the line rounded to 4 significant digits. The numbers should be in scientific notation.
7. Use a graphing calculator or online resource to view the graph of the line for #6. If you are using a graphing calculator, turn off plot 1. Leave the window settings as they are. Put the equation from #6 in "y=" and click "Graph."
Sketch a picture or insert the image of what you see on the calculator or on the screen.
- Use a graphing calculator or online resource to determine the exponential regression equation for this data. Write the equation rounded to 4 significant digits.
- Use a graphing calculator or online resource to view the graph of the equation for #8. If you are using a graphing calculator, leave the window settings as they are. Put the equation from #8 in "y=" and click "Graph." Sketch a picture or insert the image of what you see on the graphing calculator or on the screen.
- Compare your plot from #5 with your graphs in #7 and #9. Is this data linear or exponential? How do you know? Write in complete sentences.
- If your answer to #10 is linear, use the linear equation to predict the human population in the year 5000. If your answer to #10 is exponential, use the exponential equation to predict the human population in the year 5000. Find this value by substituting 5000 in for x into the selected equation. Show your work. Use 4 significant digits in your answer.
- Is it appropriate to use this rate of growth to determine the human population in the year 5000? Why or why not? Use complete sentences.
- Read the information on the following websites, and answer the questions in complete sentences.
https://worldpopulationhistory.org/carrying-capacity/ (Links to an external site.)
https://worldpopulationhistory.org/projecting-global-population/ (Links to an external site.)
part a: How does the graph titled “Human Population 1 CE – 2050 CE” compare to your plot in #5?
part b: Based on the reading, describe one way we can continue to sustain human life on Earth far into the future.
part c: If you were tasked with solving the Earth’s human population problem, what would you do? This is an “out of the box” type of question where you can be as creative as you wish.
Homework Answers
We will use concepts of lnx and GP series


Add Answer to:
I answered the First one that was making this table. I'm stuck
after.
1
Year
Population...
can somebody please help me with the question quickly I really need help with this, choose a country and research population data in order to fill out the table below.
 2. Choose a country and research population data in order to fill out the table beloa. Copy the population numbers counted each five years, as shown in the data base, for the years from 1950 to 2000 . Add a column, \(t\), measuring years șince 1945 .b. What is the country you selected? In what part of the world is it? What is the magnitude of its population numbers? \(\left(100,000^{\circ} \mathrm{s}\right.\), millions, hundred millions, billions?) Is it growing or shrinking...
Please help me, my professor wants us to explain step by step each problem but I...
 Please help me, my professor wants us to explain step by step each
problem but I cant! This is worth many points so please help me!
Thank you!
Writing Assignment 4 The following application and statements a., b., d., e., and f. can be found Sullivan's PreCalculus 9t www wennnnm edition pages 336-337. "A strain of E-coli SC18del-recA718 is placed into a nutrient broth at 30° Celsius and allowed to grow. The data given below are collected where x is...
Please help me, my professor wants us to explain step by step each
problem but I cant! This is worth many points so please help me!
Thank you!
Writing Assignment 4 The following application and statements a., b., d., e., and f. can be found Sullivan's PreCalculus 9t www wennnnm edition pages 336-337. "A strain of E-coli SC18del-recA718 is placed into a nutrient broth at 30° Celsius and allowed to grow. The data given below are collected where x is...
I need assistance with Part B and E A graphing calculator is recommended The table shows (lifetime) peptic ulcer rates (...
 I need assistance with Part B
and E
A graphing calculator is recommended The table shows (lifetime) peptic ulcer rates (per 100 population) for various family incomes as reported by the National Health Interview Survey Ulcer rate (per 100 population) 14.1 $4,000 $6,000 13.0 $8,000 13.4 12.5 $12,000 $16,000 12.0 $20,000 12.4 $30,000 10.5 $45,000 9.4 $60,000 8.2 a) Make a scatter plot of these data Tools Clear All Doloo FI Solution Object Properties Select a Tool ar Object to...
I need assistance with Part B
and E
A graphing calculator is recommended The table shows (lifetime) peptic ulcer rates (per 100 population) for various family incomes as reported by the National Health Interview Survey Ulcer rate (per 100 population) 14.1 $4,000 $6,000 13.0 $8,000 13.4 12.5 $12,000 $16,000 12.0 $20,000 12.4 $30,000 10.5 $45,000 9.4 $60,000 8.2 a) Make a scatter plot of these data Tools Clear All Doloo FI Solution Object Properties Select a Tool ar Object to...
I need someone to help answer table 1 only mass, volume, y density and table 2...
 I need someone to help answer table 1 only mass,
volume, y density and table 2 with a graph each table.
please read the procesures, thank you
Experiment 2 Graphing and Measurements Graphs summarize numerical data efficiently and are usually casier to understand and interpret than columns of numbers. In this experiment, you will collect data and construct a graph that makes an effective visual presentation. Materials: Equipment metric ruler Chemical a kit with 5 pieces Procedure: Part I: Measurements...
I need someone to help answer table 1 only mass,
volume, y density and table 2 with a graph each table.
please read the procesures, thank you
Experiment 2 Graphing and Measurements Graphs summarize numerical data efficiently and are usually casier to understand and interpret than columns of numbers. In this experiment, you will collect data and construct a graph that makes an effective visual presentation. Materials: Equipment metric ruler Chemical a kit with 5 pieces Procedure: Part I: Measurements...
by using matlab linreg() function file given below On average, the surface area A of human...
 by using matlab
linreg() function file given below
On average, the surface area A of human beings is related to weight W and height H. Measurements of several individuals of height 180cm are provided below. It is believed that the following data can be modelled using an exponential equation A = aeBW W (kg) 70 2.1 75 2.12 77 2.15 80 2.20 82 2.22 84 2.23 87 2.26 90 2.30 A (m2) A. Show by hand with pen and paper...
by using matlab
linreg() function file given below
On average, the surface area A of human beings is related to weight W and height H. Measurements of several individuals of height 180cm are provided below. It is believed that the following data can be modelled using an exponential equation A = aeBW W (kg) 70 2.1 75 2.12 77 2.15 80 2.20 82 2.22 84 2.23 87 2.26 90 2.30 A (m2) A. Show by hand with pen and paper...
First, read the article on "The Delphi Method for Graduate Research." ------ Article is posted below...
First, read the article on "The Delphi Method for Graduate Research." ------ Article is posted below Include each of the following in your answer (if applicable – explain in a paragraph) Research problem: what do you want to solve using Delphi? Sample: who will participate and why? (answer in 5 -10 sentences) Round one questionnaire: include 5 hypothetical questions you would like to ask Discuss: what are possible outcomes of the findings from your study? Hint: this is the conclusion....
 Please help me, my professor wants us to explain step by step each
problem but I cant! This is worth many points so please help me!
Thank you!
Writing Assignment 4 The following application and statements a., b., d., e., and f. can be found Sullivan's PreCalculus 9t www wennnnm edition pages 336-337. "A strain of E-coli SC18del-recA718 is placed into a nutrient broth at 30° Celsius and allowed to grow. The data given below are collected where x is...
Please help me, my professor wants us to explain step by step each
problem but I cant! This is worth many points so please help me!
Thank you!
Writing Assignment 4 The following application and statements a., b., d., e., and f. can be found Sullivan's PreCalculus 9t www wennnnm edition pages 336-337. "A strain of E-coli SC18del-recA718 is placed into a nutrient broth at 30° Celsius and allowed to grow. The data given below are collected where x is...
 I need assistance with Part B
and E
A graphing calculator is recommended The table shows (lifetime) peptic ulcer rates (per 100 population) for various family incomes as reported by the National Health Interview Survey Ulcer rate (per 100 population) 14.1 $4,000 $6,000 13.0 $8,000 13.4 12.5 $12,000 $16,000 12.0 $20,000 12.4 $30,000 10.5 $45,000 9.4 $60,000 8.2 a) Make a scatter plot of these data Tools Clear All Doloo FI Solution Object Properties Select a Tool ar Object to...
I need assistance with Part B
and E
A graphing calculator is recommended The table shows (lifetime) peptic ulcer rates (per 100 population) for various family incomes as reported by the National Health Interview Survey Ulcer rate (per 100 population) 14.1 $4,000 $6,000 13.0 $8,000 13.4 12.5 $12,000 $16,000 12.0 $20,000 12.4 $30,000 10.5 $45,000 9.4 $60,000 8.2 a) Make a scatter plot of these data Tools Clear All Doloo FI Solution Object Properties Select a Tool ar Object to...
 I need someone to help answer table 1 only mass,
volume, y density and table 2 with a graph each table.
please read the procesures, thank you
Experiment 2 Graphing and Measurements Graphs summarize numerical data efficiently and are usually casier to understand and interpret than columns of numbers. In this experiment, you will collect data and construct a graph that makes an effective visual presentation. Materials: Equipment metric ruler Chemical a kit with 5 pieces Procedure: Part I: Measurements...
I need someone to help answer table 1 only mass,
volume, y density and table 2 with a graph each table.
please read the procesures, thank you
Experiment 2 Graphing and Measurements Graphs summarize numerical data efficiently and are usually casier to understand and interpret than columns of numbers. In this experiment, you will collect data and construct a graph that makes an effective visual presentation. Materials: Equipment metric ruler Chemical a kit with 5 pieces Procedure: Part I: Measurements...
 by using matlab
linreg() function file given below
On average, the surface area A of human beings is related to weight W and height H. Measurements of several individuals of height 180cm are provided below. It is believed that the following data can be modelled using an exponential equation A = aeBW W (kg) 70 2.1 75 2.12 77 2.15 80 2.20 82 2.22 84 2.23 87 2.26 90 2.30 A (m2) A. Show by hand with pen and paper...
by using matlab
linreg() function file given below
On average, the surface area A of human beings is related to weight W and height H. Measurements of several individuals of height 180cm are provided below. It is believed that the following data can be modelled using an exponential equation A = aeBW W (kg) 70 2.1 75 2.12 77 2.15 80 2.20 82 2.22 84 2.23 87 2.26 90 2.30 A (m2) A. Show by hand with pen and paper...
Most questions answered within 3 hours.
-
If you’re standing at the bottom of a hill and asked to evaluate
it while being...
asked 1 minute ago -
A 8.15- g bullet from a 9-mm pistol has a velocity of 366.0 m/s.
It strikes...
asked 1 hour ago -
The outstanding bonds of Alpha Extracts have a yield to maturity
of 7.4 percent and a...
asked 1 hour ago -
The Problem: The Case of the Harmonizing Vacations
Your CEO is exploring partnering with a European...
asked 2 hours ago -
A chemical equation is balanced by adding coefficients in front
of some formulas so that the...
asked 2 hours ago -
From the literature (reference your sources): What are the
lattice parameters of calcite and aragonite? Why...
asked 3 hours ago -
Your system is rejecting the question am asking which is
preceded by a case study. It...
asked 3 hours ago -
3. On January 2, 2000, Larry creates a trust with himself as
trustee. Larry as trustee...
asked 3 hours ago -
A member of the volleyball team spikes the ball. During this
process, she changes the velocity...
asked 3 hours ago -
Are adult gamers less likely to use a gaming console (Xbox,
PlayStation, Wii, etc...) than teen...
asked 4 hours ago -
The University of
Texas recently reported that 43% of college students aged 18-24
would spend their...
asked 4 hours ago -
The length of stay at a specific emergency department in
Phoenix, Arizona, in 2009 had a...
asked 3 hours ago