
Homework Answers
First we need to create two lists L1 and L2 in TI 84-Plus calculator
Command: Click on STAT >>> 1: Edit
Select L1 and then click on CLEAR
Then enter the given values of first column one by one.
Then select L2 using arrow button
Then enter the given values of second column one by one.
Then select L3
and click on LN >>> 2ND >>> 2 >>> ENTER
So we get the values of L3
Now, we need to run Linear regression test:
Command:
STAT >>> TESTS >>> F : LinRegTTest...ENTER
Look the following image:

Select the input like above image and click on ENTER
So we get the following output

Then using down arrow button we get the remaining output as follows:

From the above output the linear correlation coefficients ( r ) of L1 and L2 is as follows:
r = 0.8895
and p-value = 0.0013
Decision rule:
1) If p-value < level of significance (alpha) then we reject null hypothesis
2) If p-value > level of significance (alpha) then we fail to reject null hypothesis.
Here p value = 0.0013 < 0.05 so we used first rule.
That is we reject null hypothesis
Conclusion: At 5% level of significance there are not sufficient evidence to conclude that the correlation between L1 and L2 is linear.
The linear regression line of L2 on L1 is as follows:
y = a + bx
y = -142253.3889 + 71.5833 x
Let's plug x = 1995 in the above model, we get:
y =-142253.3889+(71.5833* 1995 ) = 555.29 which is approximately equal to 555.
b) Similarly do the regression between L1 and L3
so we get the following result:
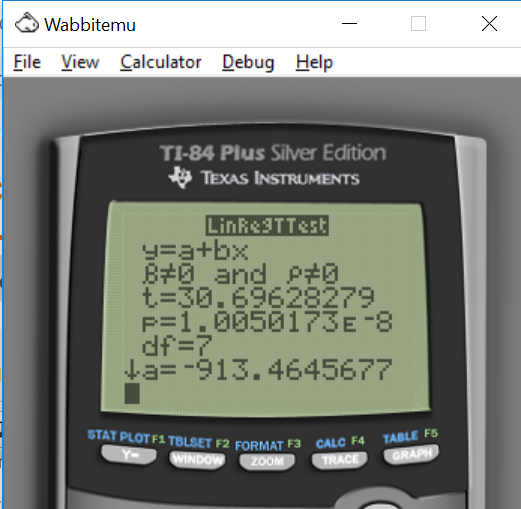

From the above output the linear correlation coefficients ( r ) of L1 and L3 is as follows:
r = 0.9963
and p-value = 0.00
Decision rule:
1) If p-value < level of significance (alpha) then we reject null hypothesis
2) If p-value > level of significance (alpha) then we fail to reject null hypothesis.
Here p value = 0.0 < 0.05 so we used first rule.
That is we reject null hypothesis
Conclusion: At 5% level of significance there are not sufficient evidence to conclude that the correlation between L1 and L3 is linear.
The linear regression line of L3 on L1 is as follows:
y = a + bx
y = -913.46 + 0.4614 x
Let's plug x = 1995 in the above model, we get:
y = -913.46 + (0.4614*1995) = 7.033
y = 7.033
Taking exponential of 7.033, we get
y = 1133.43 = 1133
The model in part b ) is better because the value of r in part b) is large than the value of r in part a).
Add Answer to:
can i get some help on this question please, thanks! The values below shows the number...
The following table shows the inflation rate and unemployment rate, both in percent, for the years...
 The following table shows the inflation rate and unemployment rate, both in percent, for the years 1981-2008. We will investigate some methods for predicting unemployment. 4.4 X (L1) y (L2) Year Inflation Unemployment 1981 8.9 7.6 1982 3.8 9.7 1983 3.8 9.6 1984 3.9 7.5 1985 3.8 7.2 1986 1.1 7 1987 6.2 1988 4.4 5.5 1989 4.6 5.3 1990 6.1 5.6 1991 3.1 6.8 1992 2.9 7.5 1993 2.7 6.9 1994 2.7 6.1 1995 2.5 5.6 1996 5.4 1997...
5.6 Year 1981 1982 1983 1984 1985 1986 1987 1988 1989 1990 1991 1992 1993 1994...
 5.6 Year 1981 1982 1983 1984 1985 1986 1987 1988 1989 1990 1991 1992 1993 1994 1995 1996 1997 1998 1999 2000 2001 2002 2003 2004 2005 2006 2007 2008 x (L1) y (L2) Inflation Unemployment 8.9 7.6 3.8 9.7 3.8 9.6 3.9 7.5 3.8 7.2 1.1 7 4.4 6.2 4.4 5.5 4.6 5.3 6.1 3.1 6.8 2.9 7.5 2.7 6.9 2.7 6.1 2.5 5.6 3.3 5.4 1.7 4.9 1.6 4.5 2.7 4.2 4 1.6 4.7 2.4 5.8 1.9 6...
The information below describes the real GDP per capita for a country for the period from...
 The information below describes the real GDP per capita for a
country for the period from 1985 through to 2001.
If a new business cycle began in 1985, how long was this
cycle?
In which year did the peak occur? The trough occurred in which
year?
How long was the expansion? How long was the recession?
Year 1985 1986 1987 1988 1989 1990 1991 1992 1993 1994 1995 1996 1997 1998 1999 2000 2001 Real GDP per Capita 6,000 6,300...
The information below describes the real GDP per capita for a
country for the period from 1985 through to 2001.
If a new business cycle began in 1985, how long was this
cycle?
In which year did the peak occur? The trough occurred in which
year?
How long was the expansion? How long was the recession?
Year 1985 1986 1987 1988 1989 1990 1991 1992 1993 1994 1995 1996 1997 1998 1999 2000 2001 Real GDP per Capita 6,000 6,300...
help please! :) Ox- (rounded to two decimal places) 8. [-/2.22 Points] DETAILS Below is the...
 help please! :)
Ox- (rounded to two decimal places) 8. [-/2.22 Points] DETAILS Below is the number of disease cases for a county by year of diagnosis. Year # cases Year # cases Year #cases Year # cases 1983 11 1990 225 1997 173 200495 1984 28 1991 243 1998 137 2005 98 1985 61 1992 | 346 1999 137 2006 112 1986 73 1993 387 2000 123 2007 87 1987 136 1994 299 2001 119 1988 153 1995 249...
help please! :)
Ox- (rounded to two decimal places) 8. [-/2.22 Points] DETAILS Below is the number of disease cases for a county by year of diagnosis. Year # cases Year # cases Year #cases Year # cases 1983 11 1990 225 1997 173 200495 1984 28 1991 243 1998 137 2005 98 1985 61 1992 | 346 1999 137 2006 112 1986 73 1993 387 2000 123 2007 87 1987 136 1994 299 2001 119 1988 153 1995 249...
Because the Florida manatee population is threatened, the Florida Maatee Sanctuary Act of 1978 was enacted...
 Because the Florida manatee population is threatened, the Florida Maatee Sanctuary Act of 1978 was enacted to protect the species. Scientists interested in the relationship between the number of manatee deaths and time collected the data shown in the table. Manatee Deaths 174 163 146 192 201 416 242 232 269 272 325 305 380 276 396 416 Manatee Deaths Year 1974 1975 1976 1977 1978 1979 1980 1981 1982 1983 1984 1985 1986 1987 1988 1989 1990 Year 1991...
A. Use a 3-year moving average to forecast the quantity of fish for the years 1983 through 2006 for these data...
 A. Use a 3-year moving average to forecast the quantity of fish for the years 1983 through 2006 for these data. Compute the error of each forecast and then determine the mean absolute deviation of error for the forecast. B. Use exponential smoothing and a = 0.2 to forecast the data through 2006. Let the forecast for 1981 equal the actual value for 1980. Compute the error of each forecast and then determine the mean absolute deviation of error for...
Please help me with these 3 questions with a picture of your graphing calculator. Thank you!!! 1) Use your graphing calculator to solve the system of equations below. Set your window to-3...
 Please help me with these 3 questions with a picture
of your graphing calculator. Thank you!!!
1) Use your graphing calculator to solve the system of equations below. Set your window to-3 Sx$3 and 3 sys 3. Use the intersect feature to calculate the intersection of the two lines. Paste your graph below, making sure the intersection point is clearly labeled. 1-2に7iiii 2) Use your graphing calculator to graph the system of inequalities below. (Hint: You can take care of...
Please help me with these 3 questions with a picture
of your graphing calculator. Thank you!!!
1) Use your graphing calculator to solve the system of equations below. Set your window to-3 Sx$3 and 3 sys 3. Use the intersect feature to calculate the intersection of the two lines. Paste your graph below, making sure the intersection point is clearly labeled. 1-2に7iiii 2) Use your graphing calculator to graph the system of inequalities below. (Hint: You can take care of...
The following table shows the winning times in minutes) for men and women in the New...
 The following table shows the winning times in minutes) for men and women in the New York City Marathon between 1984 and 2014. Assuming that performances in the Big Apple resemble performances elsewhere, we can think of these data as a sample of performance in marathon competitions. Create a 90% confidence interval for the mean difference in winning times for male and female marathon competitors. The 90% confidence interval for the mean difference in winning times (Women - Men) is...
Year Poverty Rate 1986 10.9 1987 10.7 1988 10.4 1989 10.3 1990 10.7 1991 11.5 1992...
 Year
Poverty Rate
1986
10.9
1987
10.7
1988
10.4
1989
10.3
1990
10.7
1991
11.5
1992
11.9
1993
12.3
1994
11.6
1995
10.8
1996
11
1997
10.3
1998
10
1999
9.3
2000
8.7
2001
9.2
2002
9.6
2003
10
2004
10.2
2005
9.9
2006
9.8
2007
9.8
2008
10.3
2009
11.1
According to the Census Bureau, the number of people below the poverty level has been steadily increasing (CNN, September 16, 2010). This means many families are finding themselves there...
Year
Poverty Rate
1986
10.9
1987
10.7
1988
10.4
1989
10.3
1990
10.7
1991
11.5
1992
11.9
1993
12.3
1994
11.6
1995
10.8
1996
11
1997
10.3
1998
10
1999
9.3
2000
8.7
2001
9.2
2002
9.6
2003
10
2004
10.2
2005
9.9
2006
9.8
2007
9.8
2008
10.3
2009
11.1
According to the Census Bureau, the number of people below the poverty level has been steadily increasing (CNN, September 16, 2010). This means many families are finding themselves there...
~~~~~~~~~~~~TO BE COMPLETED USING RSTUDIO~~~~~~~~~~~~~~ ~~~~~~~~~~~~(Please display all RCode used)~~~~~~~~~~~~~~ Regression Is there a relationship between...
~~~~~~~~~~~~TO BE COMPLETED USING RSTUDIO~~~~~~~~~~~~~~ ~~~~~~~~~~~~(Please display all RCode used)~~~~~~~~~~~~~~ Regression Is there a relationship between the number of stories a building has and its height? Some statisticians compiled data on a set of n = 60 buildings reported in the World Almanac. You will use the data set to decide whether height (in feet) can be predicted from the number of stories. (a) Load the data from buildings.txt. (Note that this is a text file, so use the appropriate...
 The following table shows the inflation rate and unemployment rate, both in percent, for the years 1981-2008. We will investigate some methods for predicting unemployment. 4.4 X (L1) y (L2) Year Inflation Unemployment 1981 8.9 7.6 1982 3.8 9.7 1983 3.8 9.6 1984 3.9 7.5 1985 3.8 7.2 1986 1.1 7 1987 6.2 1988 4.4 5.5 1989 4.6 5.3 1990 6.1 5.6 1991 3.1 6.8 1992 2.9 7.5 1993 2.7 6.9 1994 2.7 6.1 1995 2.5 5.6 1996 5.4 1997...
 5.6 Year 1981 1982 1983 1984 1985 1986 1987 1988 1989 1990 1991 1992 1993 1994 1995 1996 1997 1998 1999 2000 2001 2002 2003 2004 2005 2006 2007 2008 x (L1) y (L2) Inflation Unemployment 8.9 7.6 3.8 9.7 3.8 9.6 3.9 7.5 3.8 7.2 1.1 7 4.4 6.2 4.4 5.5 4.6 5.3 6.1 3.1 6.8 2.9 7.5 2.7 6.9 2.7 6.1 2.5 5.6 3.3 5.4 1.7 4.9 1.6 4.5 2.7 4.2 4 1.6 4.7 2.4 5.8 1.9 6...
 The information below describes the real GDP per capita for a
country for the period from 1985 through to 2001.
If a new business cycle began in 1985, how long was this
cycle?
In which year did the peak occur? The trough occurred in which
year?
How long was the expansion? How long was the recession?
Year 1985 1986 1987 1988 1989 1990 1991 1992 1993 1994 1995 1996 1997 1998 1999 2000 2001 Real GDP per Capita 6,000 6,300...
The information below describes the real GDP per capita for a
country for the period from 1985 through to 2001.
If a new business cycle began in 1985, how long was this
cycle?
In which year did the peak occur? The trough occurred in which
year?
How long was the expansion? How long was the recession?
Year 1985 1986 1987 1988 1989 1990 1991 1992 1993 1994 1995 1996 1997 1998 1999 2000 2001 Real GDP per Capita 6,000 6,300...
 help please! :)
Ox- (rounded to two decimal places) 8. [-/2.22 Points] DETAILS Below is the number of disease cases for a county by year of diagnosis. Year # cases Year # cases Year #cases Year # cases 1983 11 1990 225 1997 173 200495 1984 28 1991 243 1998 137 2005 98 1985 61 1992 | 346 1999 137 2006 112 1986 73 1993 387 2000 123 2007 87 1987 136 1994 299 2001 119 1988 153 1995 249...
help please! :)
Ox- (rounded to two decimal places) 8. [-/2.22 Points] DETAILS Below is the number of disease cases for a county by year of diagnosis. Year # cases Year # cases Year #cases Year # cases 1983 11 1990 225 1997 173 200495 1984 28 1991 243 1998 137 2005 98 1985 61 1992 | 346 1999 137 2006 112 1986 73 1993 387 2000 123 2007 87 1987 136 1994 299 2001 119 1988 153 1995 249...
 Because the Florida manatee population is threatened, the Florida Maatee Sanctuary Act of 1978 was enacted to protect the species. Scientists interested in the relationship between the number of manatee deaths and time collected the data shown in the table. Manatee Deaths 174 163 146 192 201 416 242 232 269 272 325 305 380 276 396 416 Manatee Deaths Year 1974 1975 1976 1977 1978 1979 1980 1981 1982 1983 1984 1985 1986 1987 1988 1989 1990 Year 1991...
 A. Use a 3-year moving average to forecast the quantity of fish for the years 1983 through 2006 for these data. Compute the error of each forecast and then determine the mean absolute deviation of error for the forecast. B. Use exponential smoothing and a = 0.2 to forecast the data through 2006. Let the forecast for 1981 equal the actual value for 1980. Compute the error of each forecast and then determine the mean absolute deviation of error for...
 Please help me with these 3 questions with a picture
of your graphing calculator. Thank you!!!
1) Use your graphing calculator to solve the system of equations below. Set your window to-3 Sx$3 and 3 sys 3. Use the intersect feature to calculate the intersection of the two lines. Paste your graph below, making sure the intersection point is clearly labeled. 1-2に7iiii 2) Use your graphing calculator to graph the system of inequalities below. (Hint: You can take care of...
Please help me with these 3 questions with a picture
of your graphing calculator. Thank you!!!
1) Use your graphing calculator to solve the system of equations below. Set your window to-3 Sx$3 and 3 sys 3. Use the intersect feature to calculate the intersection of the two lines. Paste your graph below, making sure the intersection point is clearly labeled. 1-2に7iiii 2) Use your graphing calculator to graph the system of inequalities below. (Hint: You can take care of...
 The following table shows the winning times in minutes) for men and women in the New York City Marathon between 1984 and 2014. Assuming that performances in the Big Apple resemble performances elsewhere, we can think of these data as a sample of performance in marathon competitions. Create a 90% confidence interval for the mean difference in winning times for male and female marathon competitors. The 90% confidence interval for the mean difference in winning times (Women - Men) is...
 Year
Poverty Rate
1986
10.9
1987
10.7
1988
10.4
1989
10.3
1990
10.7
1991
11.5
1992
11.9
1993
12.3
1994
11.6
1995
10.8
1996
11
1997
10.3
1998
10
1999
9.3
2000
8.7
2001
9.2
2002
9.6
2003
10
2004
10.2
2005
9.9
2006
9.8
2007
9.8
2008
10.3
2009
11.1
According to the Census Bureau, the number of people below the poverty level has been steadily increasing (CNN, September 16, 2010). This means many families are finding themselves there...
Year
Poverty Rate
1986
10.9
1987
10.7
1988
10.4
1989
10.3
1990
10.7
1991
11.5
1992
11.9
1993
12.3
1994
11.6
1995
10.8
1996
11
1997
10.3
1998
10
1999
9.3
2000
8.7
2001
9.2
2002
9.6
2003
10
2004
10.2
2005
9.9
2006
9.8
2007
9.8
2008
10.3
2009
11.1
According to the Census Bureau, the number of people below the poverty level has been steadily increasing (CNN, September 16, 2010). This means many families are finding themselves there...
Most questions answered within 3 hours.
-
1. Which of the following is NOT an argument that McMahan uses
to show that jus...
asked 18 minutes ago -
A crate slides up a frictionless slope. At the end of 3 seconds
its velocity is...
asked 35 minutes ago -
Use the following information to answer the next seven
questions.
Suppose there are three potential states...
asked 31 minutes ago -
If we only have interstitial and substitutional diffusion, then
what do we consider the process of...
asked 47 minutes ago -
You look at yourself in a shiny 9.6-cm-diameter Christmas tree
ball.
If your face is 21.0...
asked 49 minutes ago -
If we were to measure the relaxation time of a muscle after
undergoing tetanus compared to...
asked 49 minutes ago -
4CO(g) + 8H2(g) -----> 3CH4(g) +
CO2(g) + 2H2O(l)
Use the following data as needed to...
asked 52 minutes ago -
without using map
1. Write a C++ program to find out the top 10 words in...
asked 1 hour ago -
1)Calculate the percent ionization of a
0.330 M solution of hypochlorous
acid.
% Ionization = %...
asked 1 hour ago -
1a) How many grams of K2SO4 are in 250mL
of 0.11 M K2SO4 solution?
_____ g...
asked 59 minutes ago -
The vapor pressure of a solution containing 38.7 g glycerin
(C3H8O3) in 146.2 g ethanol (C2H5OH)...
asked 1 hour ago -
A physics major is cooking breakfast when he notices that the
frictional force between the steel...
asked 1 hour ago