21. A music studio faces the following demand schedule when releasing the next Compact Disc by...
21. A music studio faces the following demand schedule when releasing the next Compact Disc by Bruno Mars. The studio must pay Mr. Mars $12 million to make the CD, and the marginal cost of printing the CD is always $3 per disc. P is price, in dollars; Q is quantity demanded, listed in millions of CDs. Calculate total revenue, marginal revenue, fixed cost, marginal cost, variable cost, total cost, and profit for each quantity listed (if a column is in millions, please label it accordingly).
Price Q TR MR FC MC VC TC Profit
14 0m - -
13 1m
12 2m
11 3m
10 4m
9 5m
8 6m
7 7m
6 8m
5 9m
4 10m
What price and quantity would a profit-maximizing music studio choose? What profit will the studio make?
Show this problem graphically by graphing the Demand curve, MR, and MC, labeling everything relevant, including the equilibrium price and quantity. Show Consumer and Producer Surplus. Extra credit (1 point each): Also show the deadweight loss of monopoly (hint: extend the linear demand curve down to the x-axis). How much would the firm produce if it was owned by the government and trying to maximize economic efficiency (make total surplus as big as possible)?
(Problem continued on next
page)
Finally, assume this demand curve is representative of demand for
any Bruno Mars CD. What is the most money he could ask for in order
to make his next CD that would still allow the firm to produce the
CD? (Please answer the following hints: how do
fixed costs affect the firm’s decisions on price and quantity? What
is the minimum amount of economic profit a firm needs to still make
the product? Therefore, how much money could Bruno Mars make while
still allowing the studio to stay in business?)
Homework Answers
The following table shows total revenue,marginal revenue,fixed cost,marginal cost,variable cost,total cost and profit of printing CDs at different price and quantity
| Price | Quantity (million) |
TR (Price*Quantity) Million |
Marginal Revenue (Million) |
Fixed Cost (Million) |
Marginal Cost (Million) |
Veriable Cost (Million) |
Total Cost (Million) FC+VC |
Profit/Loss (TR-TC) Million |
| 14 | 0 | 0 | - | 12 | - | 0 | 12 | -12 |
| 13 | 1 | 13 | 13 | 12 | 3 | 3 | 15 | -2 |
| 12 | 2 | 24 | 11 | 12 | 3 | 6 | 18 | 6 |
| 11 | 3 | 33 | 9 | 12 | 3 | 9 | 21 | 12 |
| 10 | 4 | 40 | 7 | 12 | 3 | 12 | 24 | 16 |
| 9 | 5 | 45 | 5 | 12 | 3 | 15 | 27 | 18 |
| 8 | 6 | 48 | 3 | 12 | 3 | 18 | 30 | 18 |
| 7 | 7 | 49 | 1 | 12 | 3 | 21 | 33 | 16 |
| 6 | 8 | 48 | -1 | 12 | 3 | 24 | 36 | 12 |
| 5 | 9 | 45 | -3 | 12 | 3 | 27 | 39 | 6 |
| 4 | 10 | 40 | -5 | 12 | 3 | 30 | 42 | -2 |
- At price $9 and $8 ,profit is maximisied and the firm will make $18million profit
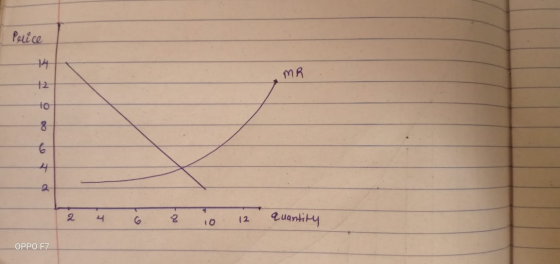
Following graph shows the demand cure and marginal revenue of CDs
Add Answer to:
21. A music studio faces the
following demand schedule when releasing the next Compact Disc by...
The studio must pay Mr. Mars 12 million to make the CD in the marginal cost of printing the CD
Show this problem graphically by graphing The demand curve. MR, and MC, labeling everything relevant, including the equilibrium price and quantity. Show consumer and producer surplus. Extra credit parentheses one point H parentheses: also show the deadweight loss of monopoly and external in your demand curve down the X axis how much with the firm produce if it was owned by the government and trying to maximize economic efficiency make total surplus as big as possible
1. Suppose that a single-price monopolist faces the demand function P 100 Q where I is...
 1. Suppose that a single-price monopolist faces the demand function P 100 Q where I is average weekly household income, and that the firm's marginal cost function is given by MC(Q) 2Q. The firm has no fixed costs. = (a) If the average weekly household income is $600, find the firm's marginal revenue function. (b) What is the firm's profit-maximizing quantity of output? At what price will the firm sell that output? What will the firm's marginal cost be? (c)...
A monopolist faces a market demand curve given by
A monopolist faces a market demand curve given by Q=70-P a. If the monopolist can produce at constant average and marginal costs ofAC-MC-6, what output level will the monopolist choose to maximize profits? What is the price at this output level? What are the monopolist's profits? b. Assume instead that the monopolist has a cost structure where total costs are described by C(Q) = 0.25Q2 - 5Q + 300. With the monopolist facing the same market demand and marginal revenue, what price-quantity combination will be chosen now...
Suppose that a movie studio is deciding on the quality ξ of its next film. Anticipated revenues i...
 Suppose that a movie studio is deciding on the quality ξ of its next film. Anticipated revenues in $millions (from ticket sales, downloads, licensing to Netflix, etc) equal R(f)-10ξ + 5ξ2. more expensive to make better movies so costs are given by C()-6 * (f2 + 4). 2. It's a. Find the profit-maximizing quality b. How much money can the studio make if it chooses the optimal? c. Confirm that at the optimum MR MC, d. What fixed cost would...
A monopoly firm faces the following demand curve: P = 25-2.5 QD. 1)Create the demand schedule...
A monopoly firm faces the following demand curve: P = 25-2.5 QD. 1)Create the demand schedule for the firm by increasing quantity demanded in increments of one unit. 2)Produce a table with the total revenue and marginal revenue for the output levels in increments of one unit. 3)If the firm’s marginal cost is constant at $12.50 per unit, what is the profit maximizing output and price? 4)What is the efficient quantity and price? 5)What is the value of the deadweight...
UIZ 11Suructions Question 3 2 pts The following figure depicts a generalized downward-sloping market demand (D)...
 UIZ 11Suructions Question 3 2 pts The following figure depicts a generalized downward-sloping market demand (D) curve for a product. It also shows the firm's relevant marginal revenue (MR) curve and marginal cost (MC) curve. Use this figure to answer the next six questions Price $10 10 + 20 + 30 40 + 50 + 60 Quantity If the firm can price discriminate perfectly, what would the producer surplus be? $120 $0 $160 500 O $40
Name: Consider the market for a good where the demand curve facing a firm who has...
 Name: Consider the market for a good where the demand curve facing a firm who has considerable market power is given by P = 80 -0.05Q, the marginal revenue curve is given by MR = 80 -0.1Q, and the firm's marginal cost curve is given by MC = 17 + 0.020. a. If the firm behaves like a competitive firm, find equilibrium price and quantity. Graphically identify and calculate consumer and producer surplus. b. If the firm behaves like a...
The following graph shows the demand (D) for gas services in a particular town. The graph...
 The following graph shows the demand (D) for gas services in a particular town. The graph also shows the marginal revenue (MR) curve, the marginal cost (MC) curve, and the average total cost (ATC) curve for the local gas company, a natural monopolist. PRICE (Dollars per hundred cubic feet) P4 ATC P3 P2 P1 MC MR I 01 02 03 QUANTITY (Hundreds of cubic feet) Based solely on the graph, which of the following principal types of barriers to entry...
Consider the local telephone company, a natural monopoly. The following graph shows the demand curve for...
 Consider the local telephone company, a natural monopoly. The following graph shows the demand curve for phone services, the company's marginal revenue curve (labeled MR), its marginal cost curve (labeled MC), and its average total cost curve (labeled ATC). You can hover over the points on the graph to see their exact coordinates. PRICE, COST, MR (Dollars per month) 100 90 80 70 60 Demand 50 40 30 ATC 20 MC 10 MR 54 60 30 36 42 48 0...
Graph Worksheet MC DI MR P4 ATC P3 P2 AVC PI 02 1. What is the...
 Graph Worksheet MC DI MR P4 ATC P3 P2 AVC PI 02 1. What is the price and quantity at the optimum level of production? Is this an economic profit, loss, or break-even? Should the firm produce? 2. If the industry model is monopolistic competition, what will happen to the industry? What will happen to the demand and marginal revenue curves for the individual firm? In the long run where will the demand curve be? Will the firm achieve productive...
 1. Suppose that a single-price monopolist faces the demand function P 100 Q where I is average weekly household income, and that the firm's marginal cost function is given by MC(Q) 2Q. The firm has no fixed costs. = (a) If the average weekly household income is $600, find the firm's marginal revenue function. (b) What is the firm's profit-maximizing quantity of output? At what price will the firm sell that output? What will the firm's marginal cost be? (c)...
 Suppose that a movie studio is deciding on the quality ξ of its next film. Anticipated revenues in $millions (from ticket sales, downloads, licensing to Netflix, etc) equal R(f)-10ξ + 5ξ2. more expensive to make better movies so costs are given by C()-6 * (f2 + 4). 2. It's a. Find the profit-maximizing quality b. How much money can the studio make if it chooses the optimal? c. Confirm that at the optimum MR MC, d. What fixed cost would...
 UIZ 11Suructions Question 3 2 pts The following figure depicts a generalized downward-sloping market demand (D) curve for a product. It also shows the firm's relevant marginal revenue (MR) curve and marginal cost (MC) curve. Use this figure to answer the next six questions Price $10 10 + 20 + 30 40 + 50 + 60 Quantity If the firm can price discriminate perfectly, what would the producer surplus be? $120 $0 $160 500 O $40
 Name: Consider the market for a good where the demand curve facing a firm who has considerable market power is given by P = 80 -0.05Q, the marginal revenue curve is given by MR = 80 -0.1Q, and the firm's marginal cost curve is given by MC = 17 + 0.020. a. If the firm behaves like a competitive firm, find equilibrium price and quantity. Graphically identify and calculate consumer and producer surplus. b. If the firm behaves like a...
 The following graph shows the demand (D) for gas services in a particular town. The graph also shows the marginal revenue (MR) curve, the marginal cost (MC) curve, and the average total cost (ATC) curve for the local gas company, a natural monopolist. PRICE (Dollars per hundred cubic feet) P4 ATC P3 P2 P1 MC MR I 01 02 03 QUANTITY (Hundreds of cubic feet) Based solely on the graph, which of the following principal types of barriers to entry...
 Consider the local telephone company, a natural monopoly. The following graph shows the demand curve for phone services, the company's marginal revenue curve (labeled MR), its marginal cost curve (labeled MC), and its average total cost curve (labeled ATC). You can hover over the points on the graph to see their exact coordinates. PRICE, COST, MR (Dollars per month) 100 90 80 70 60 Demand 50 40 30 ATC 20 MC 10 MR 54 60 30 36 42 48 0...
 Graph Worksheet MC DI MR P4 ATC P3 P2 AVC PI 02 1. What is the price and quantity at the optimum level of production? Is this an economic profit, loss, or break-even? Should the firm produce? 2. If the industry model is monopolistic competition, what will happen to the industry? What will happen to the demand and marginal revenue curves for the individual firm? In the long run where will the demand curve be? Will the firm achieve productive...
Most questions answered within 3 hours.
-
Based on historical data, your team knows what proportion of the
company's orders come from Males...
asked 11 minutes ago -
8. Which of the following atoms has the largest magnitude
electron affinity?
(a) Sodium (Na)
(b)...
asked 14 minutes ago -
Assess the two types of tests of cognitive abilities. (
regarding HR course)
asked 18 minutes ago -
1.Write an inspiring vision statement for an organization where
you work or have worked. If the...
asked 20 minutes ago -
2. Is fair trade coffee sustainable for the mass market,
or is it a niche product...
asked 20 minutes ago -
Please answer this asap in MATLAB.
In the following for loop, the the loop is executed...
asked 33 minutes ago -
A 50.0-g golf ball is driven from the tee with an initial speed
of 44.6 m/s...
asked 28 minutes ago -
Use the molar concentration of the 50 mL solution to calculate
the moles of Cr(III) in...
asked 30 minutes ago -
Calculate the molarity of Fe3+ in solution A.
Solution A: 10 mL of 0.0600 M Fe(No3)3 ...
asked 39 minutes ago -
two dogs pull 2 strings horizontally which are tied to a sleigh.
the angle between the...
asked 39 minutes ago -
please write a paper about any ethical violation based on the
case study Stanford's Prison Experiment....
asked 1 hour ago -
What is the advantage of considering each of the
following in calculating the work done by...
asked 1 hour ago