
Homework Answers
Add Answer to:
Questions 19 and 20 related to the following: The lower and upper end of a 95%...
The lower and upper end of a 95% interval estimate of the population proportion are, respectively,...
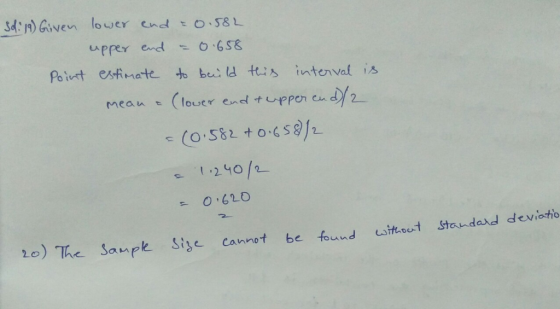
The lower and upper end of a 95% interval estimate of the population proportion are, respectively, 0.582 and 0.658. 19 The point estimate to build this interval is, a 0.634 b 0.630 c 0.628 d 0.620 20 The sample size to build this interval estimate is, a 675 b 649 c 627 d 615
Questions 19 and 20 related to the following: The lower and upper end of a 95%...
Questions 19 and 20 related to the following: The lower and upper end of a 95% interval estimate of the population proportion are, respectively, 0.556 and 0.604. The point estimate to build this interval is, 0.57 0.575 0.58 0.592 The sample size to build this interval estimate is, 1625 1545 1456 1358
B1 Questions 19 and 20 related to the following: 82 The lower and upper end of...
 B1 Questions 19 and 20 related to the following: 82 The lower and upper end of a 95% interval estimate of the population proportion are, 183 respectively, 0.556 and 0.604. 184 19 The point estimate to build this interval is, 185 a 0.57 186 b 0.575 187 C 0.58 1188 d 0.592 189 190 20 The sample size to build this interval estimate is, 191 a 1625 192 b 1545 193 C 1456 194 1358
Questions 15-18 are related to the following: In a sample of n = 600 IUPUI undergraduate students polled x = 216 stated...
Questions 15-18 are related to the following: In a sample of n = 600 IUPUI undergraduate students polled x = 216 stated that they are planning to go to graduate school. 15 The point estimate of the population proportion of students planning to go to graduate school is, 0.38 0.37 0.36 0.35 The standard error of the sample proportion is, 0.0196 0.0213 0.0243 0.0277 The margin or error for a 95% confidence interval for the population proportion is, 0.024 0.028...
113 The margin of error for the 95% confidence interval of the mean fill is. 2...
 113 The margin of error for the 95% confidence interval of the mean fill is. 2 A 0.48 3 B 0.41 4 C 0.36 5 D 0.32 714 As a class project, each of 280 students taking E270 is required to obtain a sample of n = 100 students and build a B 95% confidence interval for the distance travelled to the campus. The instructor thus receives 280 different interval e estimates. The instructor would expect_ ofthese intervals to capture...
Info for questions 19 and 20: In a recent poll of 1100 randomly selected home delivery...
 Info for questions 19 and 20: In a recent poll of 1100 randomly selected home delivery truck drivers, 26% said they had encountered an aggressive dog on the job at least once. Report the lower and upper limits of the 95% confidence interval for the proportion of all home delivery truck drivers who have encountered an aggressive dog on the job at least once. Round to the nearest tenth of a percent. Question 19 1 pts Lower limit. Question 20...
Next SIX questions are related to the following data: The following is a random sample of...
Next SIX questions are related to the following data: The following is a random sample of n = 90 undergraduate students' annual textbook expense. 610 600 300 420 520 470 430 520 400 370 730 480 450 500 650 370 540 330 690 550 450 450 750 750 660 700 300 770 760 390 680 450 590 630 530 700 580 390 330 320 350 490 310 320 780 590 370 470 760 550 630 450 640 620 520 440...
For the following question (#19 and #20), please use the following multiple regression output. The dependent...
 For the following question (#19 and #20), please use the following multiple regression output. The dependent variable is Home Price: ($) the independent variables are Number of Bedrooms, Size (square footage), and Pool (0 = no pool, 1 = pool). 19: Which statement is correct? SUMMARY OUTPUT A: The R square of 571 is the best goodness of fit statistic to use for multiple regression analyses. B: The Number of Bedrooms is not a significant predictor variable. Regression Statistics Multiple...
I just need help with questions 5 and 6 370 300 630 530 Next SIX questions...
 I just need help with questions 5 and 6
370 300 630 530 Next SIX questions are related to the following data: The following is a random sample of n = 90 undergraduate students' annual textbook expense. 610 600 300 420 520 470 430 520 400 370 730 480 450 500 650 540 330 690 550 450 450 750 750 660 700 770 760 390 680 590 700 580 390 330 320 350 490 310 320 780 370 760 630...
I just need help with questions 5 and 6
370 300 630 530 Next SIX questions are related to the following data: The following is a random sample of n = 90 undergraduate students' annual textbook expense. 610 600 300 420 520 470 430 520 400 370 730 480 450 500 650 540 330 690 550 450 450 750 750 660 700 770 760 390 680 590 700 580 390 330 320 350 490 310 320 780 370 760 630...
Stout - STAI 130-900C - Fall 19. WU > Activities and Due Dates > HW-(16) Assignment...
 Stout - STAI 130-900C - Fall 19. WU > Activities and Due Dates > HW-(16) Assignment Score: 500/1000 Resources C Give Up? Check Answer Question 10 of 10 > An NHANES report gives data for 652 women aged 20-29 years. The BMI of these 662 women was -26.6. On the Student Assignment Container basis of this sample, we want to estimate the BMI w in the population of all 20.6 million women in this age groc treated these data as...
 B1 Questions 19 and 20 related to the following: 82 The lower and upper end of a 95% interval estimate of the population proportion are, 183 respectively, 0.556 and 0.604. 184 19 The point estimate to build this interval is, 185 a 0.57 186 b 0.575 187 C 0.58 1188 d 0.592 189 190 20 The sample size to build this interval estimate is, 191 a 1625 192 b 1545 193 C 1456 194 1358
 113 The margin of error for the 95% confidence interval of the mean fill is. 2 A 0.48 3 B 0.41 4 C 0.36 5 D 0.32 714 As a class project, each of 280 students taking E270 is required to obtain a sample of n = 100 students and build a B 95% confidence interval for the distance travelled to the campus. The instructor thus receives 280 different interval e estimates. The instructor would expect_ ofthese intervals to capture...
 Info for questions 19 and 20: In a recent poll of 1100 randomly selected home delivery truck drivers, 26% said they had encountered an aggressive dog on the job at least once. Report the lower and upper limits of the 95% confidence interval for the proportion of all home delivery truck drivers who have encountered an aggressive dog on the job at least once. Round to the nearest tenth of a percent. Question 19 1 pts Lower limit. Question 20...
 For the following question (#19 and #20), please use the following multiple regression output. The dependent variable is Home Price: ($) the independent variables are Number of Bedrooms, Size (square footage), and Pool (0 = no pool, 1 = pool). 19: Which statement is correct? SUMMARY OUTPUT A: The R square of 571 is the best goodness of fit statistic to use for multiple regression analyses. B: The Number of Bedrooms is not a significant predictor variable. Regression Statistics Multiple...
 I just need help with questions 5 and 6
370 300 630 530 Next SIX questions are related to the following data: The following is a random sample of n = 90 undergraduate students' annual textbook expense. 610 600 300 420 520 470 430 520 400 370 730 480 450 500 650 540 330 690 550 450 450 750 750 660 700 770 760 390 680 590 700 580 390 330 320 350 490 310 320 780 370 760 630...
I just need help with questions 5 and 6
370 300 630 530 Next SIX questions are related to the following data: The following is a random sample of n = 90 undergraduate students' annual textbook expense. 610 600 300 420 520 470 430 520 400 370 730 480 450 500 650 540 330 690 550 450 450 750 750 660 700 770 760 390 680 590 700 580 390 330 320 350 490 310 320 780 370 760 630...
 Stout - STAI 130-900C - Fall 19. WU > Activities and Due Dates > HW-(16) Assignment Score: 500/1000 Resources C Give Up? Check Answer Question 10 of 10 > An NHANES report gives data for 652 women aged 20-29 years. The BMI of these 662 women was -26.6. On the Student Assignment Container basis of this sample, we want to estimate the BMI w in the population of all 20.6 million women in this age groc treated these data as...
Most questions answered within 3 hours.
-
3) What are the typical social structures in a global city?
asked 1 hour ago -
Luther Corporation
Consolidated Balance Sheet
December 31, 2019 and 2018 (in $ millions)
Assets
2019
2018...
asked 1 hour ago -
(Expected rate of return and risk) Carter Inc. is evaluating a
security. Calculate the investment’s expected...
asked 4 hours ago -
What specific indicators can point to lack of progress for
African Americans in American society?
asked 5 hours ago -
1-The Electrons in a beam are moving at 2.7×10⁸ m/s in an
electric field of 15000...
asked 5 hours ago -
A gas tank is a vertical cylinder. It has a radius of 1m, a
height of...
asked 6 hours ago -
Accent Software faces the following conditions. All of these
support Accent’s use of a market-penetration pricing...
asked 7 hours ago -
A mathematically inclined friend emails you the following
instructions: "Meet me in the cafeteria the first...
asked 7 hours ago -
A monopoly sells in two countries . The demand curves in the two
countries are p1...
asked 8 hours ago -
A .15kg rubber ball is bounced off a wall. Before hitting the
wall, the ball moves...
asked 8 hours ago -
A manufacturing company preparing to build a new plant is
considering three potential locations for it....
asked 8 hours ago -
B. If compound Y has approximately the same values of solubility
in toluene as compound X,...
asked 9 hours ago