I dont know what data needs to be given but the mean for this variable is...
I dont know what data needs to be given but the mean for this variable is 8,614.10 and the S.D (range) is 4838. The sample size is 30
Need help estimating a parameter based on a statistic.
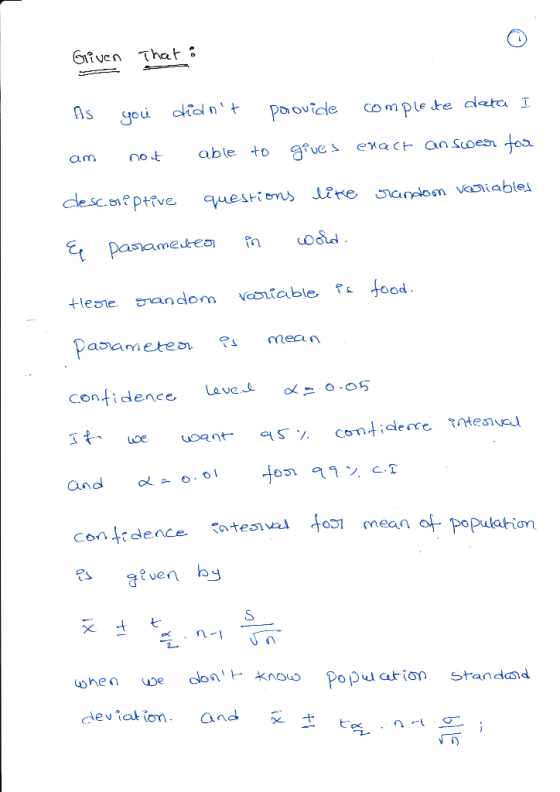
Variable: Food
State the random variable and parameter in words:
Confidence interval method including confidence level and rationale for using it:
State and Check the assumption for confidence interval:
Method used to analyze data:
Find the sample statistic and confidence interval:
Statistical interpretation:
Homework Answers
Solution:
Add Answer to:
I dont know what data needs to be given but the mean for this
variable is...
Part A: Inferential Statistics Data Analysis Plan and Computation Variables Selected: Table 1: Variables Selected for...
 Part A: Inferential Statistics Data Analysis Plan and Computation Variables Selected: Table 1: Variables Selected for Analysis Variable Name in the Data Set Variable Type Variable1 Variable2 Variable 3 Data Analysis: 1. Confidence Interval Analysis: For one expenditure variable, select and run the appropriate method for estimating a parameter, based on a statistic (i.e, confidence interval method) and complete the following table (Note: Format follows Kozak outline): Table 2: Confidence Interval Information and Name of Variable: State the Random Variable...
Part A: Inferential Statistics Data Analysis, Plan and Computation Introduction: Variables Selected: Any two variables out...
Part A: Inferential Statistics Data Analysis, Plan and Computation Introduction: Variables Selected: Any two variables out of Income, Age, Food, Meat, Bakery, Fruits. Table 1: Quantitative Variables from the given Dataset spreadsheet Selected for Analysis Variable Name Description Variable 1: Variable 2: Data Analysis: 1. Confidence Interval Analysis: For one quantitative variable, select and run the appropriate method for estimating a parameter, based on a statistic (i.e., confidence interval method) and complete the following Table 2. Table 2: Confidence Interval...
i have this project on statistics and I dont know how to go about it. i...
i have this project on statistics and I dont know how to go about it. i sm to pick a topic and it was going to be Age and dementia. please can someone help as i am so frustrated already. In some cases, the relationship between the two variables is a linear one. In this project, you will need to choose a pair of real-world variables, collect data on those variables, and describe the relationship between the variables. To complete...
2 Quantitative Variables My research question was… (What did you want to know?) I hypothesize that … (What did you think was going to happen?) The rationale for this hypothesis is… (Why did you think...
2 Quantitative Variables My research question was… (What did you want to know?) I hypothesize that … (What did you think was going to happen?) The rationale for this hypothesis is… (Why did you think that?) State how you intend to analyze your data (graphical and statistical test) Graph representing the relationship Output of your statistical test Summary of your findings in relation to your research question including the citation of your statistical test. Scatter plot Shoe size-Vs-Height 300 250...
#4 please QUESTION 3 For this question we will analyze data from the most detailed, up-to-date...
 #4 please
QUESTION 3 For this question we will analyze data from the most detailed, up-to-date portrait of ho poiple in the United States spend their time- it American Time Use Survey. The survey offerns also offers some insight into how Amexica ns veicise and eat. I have included all the information you need to answer this question without yoar nooding to access the data yourself (although it is publicly available). The data are drawn from a sample of n-...
#4 please
QUESTION 3 For this question we will analyze data from the most detailed, up-to-date portrait of ho poiple in the United States spend their time- it American Time Use Survey. The survey offerns also offers some insight into how Amexica ns veicise and eat. I have included all the information you need to answer this question without yoar nooding to access the data yourself (although it is publicly available). The data are drawn from a sample of n-...
QUESTION 3: For this question we will analyze data from the 2014 American Time Use Survey. The su...
 QUESTION 3: For this question we will analyze data from the 2014 American Time Use Survey. The survey offers the most detailed, up-to-date portrait of how people in the United States spend their time it also offers some insight into how Americans exercise and eat. I have included all the information you need to answer this question without your needing to access the data yourself (although it is publicly available). The data are drawn from a sample of n= 11,592...
Data Summaries Sample Mean Sample Std Dev Sample Size 79.998 11.588 1000 Hypothesis Testing Confidence Interval...
 Data Summaries Sample Mean Sample Std Dev Sample Size 79.998 11.588 1000 Hypothesis Testing Confidence Interval Creation Level of Confidence: 95% Alpha (a) Value: 0.05 MOE 0.719 9 - MOE: 79.279 9 + MOE: 80.717 Confidence Interval Question What is the confidence interval telling you about the population parameter? Use the formula: df = n-1 Use the formula: (9-4_0)/(s/sqrt(n)) Degrees of Freedom: Alpha (a) Value: Test Statistic Value: Is your test statistic a z value or at value? P-Value Method...
Inference Project - Roll a Die Data (Perform an experiment to obtain data and perform a hypothesi...
Inference Project - Roll a Die Data (Perform an experiment to obtain data and perform a hypothesis test of your results) 1. For this project you will need to Give an explanation of how you created/obtained your data and who/what it is about. Please be specific about your process. Give the population your sample comes from or if you are compare your sample to a given known value. Give the sample statistic (proportion or mean) of the variable you are...
1. A C level confidence interval is described as what? (3 points) Oan interval computed from...
 1. A C level confidence interval is described as what? (3 points) Oan interval computed from a data sample by a method that has the probability C of producing an interval containing the true value of the parameter any interval within the margin of error O an interval with a margin of error C that is also correct C% of the time Oany interval that follows the 68-95-99.7 rules Oan interval computed from a data sample that guarantees that the...
A study was conducted that measured the total brain volume (TBV) (in ) of patients that...
A study was conducted that measured the total brain volume (TBV) (in ) of patients that had schizophrenia and patients that are considered normal. Table #9.3.5 contains the TBV of the normal patients and table #9.3.6 contains the TBV of schizophrenia patients ("SOCR data oct2009," 2013). Is there enough evidence to show that the patients with schizophrenia have less TBV on average than a patient that is considered normal? Test at the 10% level. Table #9.3.5: Total Brain Volume (in ) of Normal...
 Part A: Inferential Statistics Data Analysis Plan and Computation Variables Selected: Table 1: Variables Selected for Analysis Variable Name in the Data Set Variable Type Variable1 Variable2 Variable 3 Data Analysis: 1. Confidence Interval Analysis: For one expenditure variable, select and run the appropriate method for estimating a parameter, based on a statistic (i.e, confidence interval method) and complete the following table (Note: Format follows Kozak outline): Table 2: Confidence Interval Information and Name of Variable: State the Random Variable...
 #4 please
QUESTION 3 For this question we will analyze data from the most detailed, up-to-date portrait of ho poiple in the United States spend their time- it American Time Use Survey. The survey offerns also offers some insight into how Amexica ns veicise and eat. I have included all the information you need to answer this question without yoar nooding to access the data yourself (although it is publicly available). The data are drawn from a sample of n-...
#4 please
QUESTION 3 For this question we will analyze data from the most detailed, up-to-date portrait of ho poiple in the United States spend their time- it American Time Use Survey. The survey offerns also offers some insight into how Amexica ns veicise and eat. I have included all the information you need to answer this question without yoar nooding to access the data yourself (although it is publicly available). The data are drawn from a sample of n-...
 QUESTION 3: For this question we will analyze data from the 2014 American Time Use Survey. The survey offers the most detailed, up-to-date portrait of how people in the United States spend their time it also offers some insight into how Americans exercise and eat. I have included all the information you need to answer this question without your needing to access the data yourself (although it is publicly available). The data are drawn from a sample of n= 11,592...
 Data Summaries Sample Mean Sample Std Dev Sample Size 79.998 11.588 1000 Hypothesis Testing Confidence Interval Creation Level of Confidence: 95% Alpha (a) Value: 0.05 MOE 0.719 9 - MOE: 79.279 9 + MOE: 80.717 Confidence Interval Question What is the confidence interval telling you about the population parameter? Use the formula: df = n-1 Use the formula: (9-4_0)/(s/sqrt(n)) Degrees of Freedom: Alpha (a) Value: Test Statistic Value: Is your test statistic a z value or at value? P-Value Method...
 1. A C level confidence interval is described as what? (3 points) Oan interval computed from a data sample by a method that has the probability C of producing an interval containing the true value of the parameter any interval within the margin of error O an interval with a margin of error C that is also correct C% of the time Oany interval that follows the 68-95-99.7 rules Oan interval computed from a data sample that guarantees that the...
Most questions answered within 3 hours.
-
the following reaction occurs in a balloon containing
N2O2 gas
N2O4(g)=2NO2(g)
will the volume of the...
asked 13 minutes ago -
answer the questions throughout this program
public class Day implements Comparable {
Private Boolean atWork;...
asked 20 minutes ago -
This is C++ code for parking fee management program
#include <iostream>
#include <iomanip>
using namespace std;...
asked 31 minutes ago -
The free energy change for the following reaction at 25 °C, when
[Sn2+] = 1.17 M...
asked 2 hours ago -
An MNE is this kind of industry when competition in one country
is essentially independent of...
asked 3 hours ago -
. For this set of questions, determine what
proportion of a normal distribution is located betweeneach...
asked 4 hours ago -
A college student is employed as a door-to-door newspaper
salesman. Historical data suggests that the student...
asked 5 hours ago -
MATLAB HW 11 problem using Switch Case and Input commands
Write a script file that calculates...
asked 5 hours ago -
Considering gravitational time dilation, calculate the time that
passes in Earth’s surface while 1 hour passes...
asked 5 hours ago -
Minitab Problem: Take the Lake Hume June rainfall data and find
use the processes outlined in...
asked 6 hours ago -
X Company is trying to decide whether to continue using old
equipment to make Product A...
asked 6 hours ago -
IN PYTHON ONLY !! Program 2: Re-work
program #5 (WeeklyHours) from the previous assignment such that...
asked 7 hours ago