
Homework Answers
Solution2:
To pedict height based on head circumference
height=dependent variable
head circumference=independent variable
Rcode:
datar<-"Height(cm) Head_Circumference(cm)
179 60
161 55
162 57
155 60
158 56
172 57
191 60
179 57
163 58"
datan<-read.table(textConnection(object=datar),
header=TRUE,
sep="",
stringsAsFactors = FALSE)
datan
hist(datan$Height.cm.,main="Histogram of Height",col="blue")
hist(datan$Head_Circumference.cm.,main="Histogram of Head
circumference",col="green")boxplot(datan$Height.cm.,main="Boxplot
of Height",col="blue")
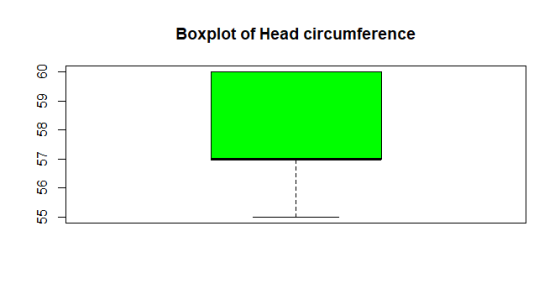
boxplot(datan$Head_Circumference.cm.,main="Boxplot of Head
circumference",col="green")
qqnorm(datan$Height.cm.,main="Normal Q-Q plot for Height")
qqline(datan$Height.cm.)
Output:


yes response variable height is not approximatey normal.since mean >median value it is positively skewed
From histogram of circumference,it is approximately normally distributed
From histogram of height,it is positively skewed
No outliers found for height or circumeference from boxplots.
Add Answer to:
Please help me with these questions with R codes.. thank
you!!
Here’s the data I have...
Please provide with R codes! thank you!! Data: Question: Data: 179 161 162 605557 155 60...
 Please provide with R codes! thank you!!
Data:
Question:
Data: 179 161 162 605557 155 60 158 56 172 57 191 60 179 57 163 58 Height (cm) Head Circumference (cm) 2. Draw at most 3 plots to visually describe your data. Is your response variable approximately Normal? 3. Numerically describe the centre, spread and any unusual points of your variables/data. 4. Fit and describe a simple linear regression model between head circumference and height. 5. Are the regression parameters...
Please provide with R codes! thank you!!
Data:
Question:
Data: 179 161 162 605557 155 60 158 56 172 57 191 60 179 57 163 58 Height (cm) Head Circumference (cm) 2. Draw at most 3 plots to visually describe your data. Is your response variable approximately Normal? 3. Numerically describe the centre, spread and any unusual points of your variables/data. 4. Fit and describe a simple linear regression model between head circumference and height. 5. Are the regression parameters...
Do 2.3.4 Use the data "Orange" in R. You should include the r code as well...
 Do 2.3.4
Use the data "Orange" in R. You should include the r code as well as the output in your file, with appropriate answer to questions. Answer the following questions in your document 1. Fit a simple linear regression using "circumterence" as response and "age" as predictor. Is there a significant linear relationship between the two variables? State the null and alternative hypothesis, test statistic and p-value 2. Find which observation has the largest residual in absolute value) Give...
Do 2.3.4
Use the data "Orange" in R. You should include the r code as well as the output in your file, with appropriate answer to questions. Answer the following questions in your document 1. Fit a simple linear regression using "circumterence" as response and "age" as predictor. Is there a significant linear relationship between the two variables? State the null and alternative hypothesis, test statistic and p-value 2. Find which observation has the largest residual in absolute value) Give...
The Book of R (Question 20.2) Please answer using R code. Continue using the survey data...
The Book of R (Question 20.2) Please answer using R code. Continue using the survey data frame from the package MASS for the next few exercises. The survey data set has a variable named Exer , a factor with k = 3 levels describing the amount of physical exercise time each student gets: none, some, or frequent. Obtain a count of the number of students in each category and produce side-by-side boxplots of student height split by exercise. Assuming independence...
Exercise 1. For this exercise use the bdims data set from the openintro package. Type ?bdims to r...
 Exercise 1. For this exercise use the bdims data set from the openintro package. Type ?bdims to read about this data set in the help menu. Of interest are the variables hgt (height in centimeters), wgt (weight in kilograms), and sex (dummy variable with 1-male, 0-female). Since ggplotO requires that a categorical variable be coded as a factor type in R, run the following code: library (openintro) bdíms$sex2 <-factor (bdins$sex, levels-c (0,1), labels=c('F', 'M')) (a) Use ggplot2 to make a...
USE R STUDIO The stackloss data frame available in R contains 21 observations on four variables...
USE R STUDIO The stackloss data frame available in R contains 21 observations on four variables taken at a factory where ammonia is converted to nitric acid. The first three variables are Air.Flow, Water.Temp, and Acid.Conc. The fourth variable is stack.loss, which measures the amount of ammonia that escapes before being absorbed. Read the help file for more information about this data frame. - Give a numerical summarization of each column of the dataset, then use boxplots to help illustrating...
Need help with stats true or false questions Decide (with short explanations) whether the following statements are true or false a) We consider the model y-Ao +A(z) +E. Let (-0.01, 1.5) be a 95% con...
 Need help with stats true or false questions
Decide (with short explanations) whether the following statements are true or false a) We consider the model y-Ao +A(z) +E. Let (-0.01, 1.5) be a 95% confidence interval for A In this case, a t-test with significance level 1% rejects the null hypothesis Ho : A-0 against a two sided alternative. b) Complicated models with a lot of parameters are better for prediction then simple models with just a few parameters c)...
Need help with stats true or false questions
Decide (with short explanations) whether the following statements are true or false a) We consider the model y-Ao +A(z) +E. Let (-0.01, 1.5) be a 95% confidence interval for A In this case, a t-test with significance level 1% rejects the null hypothesis Ho : A-0 against a two sided alternative. b) Complicated models with a lot of parameters are better for prediction then simple models with just a few parameters c)...
For expert using R , I solve it but i need to figure out what I...
 For expert using R , I solve it but i need to figure out what
I got is correct or wrong. Thank you
# Simple Linear Regression and Polynomial Regression
# HW 2
#
# Read data from csv file
data <-
read.csv("C:\data\SweetPotatoFirmness.csv",header=TRUE,
sep=",")
head(data)
str(data)
# scatterplot of independent and dependent variables
plot(data$pectin,data$firmness,xlab="Pectin,
%",ylab="Firmness")
par(mfrow = c(2, 2)) # Split the plotting panel into a 2 x 2
grid
model <- lm(firmness ~ pectin , data=data)
summary(model)
anova(model)
plot(model)...
For expert using R , I solve it but i need to figure out what
I got is correct or wrong. Thank you
# Simple Linear Regression and Polynomial Regression
# HW 2
#
# Read data from csv file
data <-
read.csv("C:\data\SweetPotatoFirmness.csv",header=TRUE,
sep=",")
head(data)
str(data)
# scatterplot of independent and dependent variables
plot(data$pectin,data$firmness,xlab="Pectin,
%",ylab="Firmness")
par(mfrow = c(2, 2)) # Split the plotting panel into a 2 x 2
grid
model <- lm(firmness ~ pectin , data=data)
summary(model)
anova(model)
plot(model)...
4. The anscombe data set in the datasets R package (should automatically be loaded) contains 4 pa...
 4. The anscombe data set in the datasets R package (should automatically be loaded) contains 4 pairs of response-explanatory variables. The pairs are xl-yl, x2-y2, x3-y3, and x4-y4 where x is the explanatory variable and y is the response variable. (a) Run 4 simple linear regression analyses (one on each of the 4 pairs) to verify that the regression output is exactly the same (up to numerical accuracy) b) For each pair, describe what is wrong (if anything) and use...
**R-STUDIO KNOWLEDGE REQUIRED*** PLEASE ANSWER THE FOLLOWING WITH ****R-STUDIO**** CODING- thank ...
 **R-STUDIO KNOWLEDGE REQUIRED***
PLEASE ANSWER THE FOLLOWING WITH ****R-STUDIO****
CODING- thank you so much!!
I am specifically look for the solution to part
***(h)**** and *****(i)***** below using R-Studio
code:
The data set in question
is:
YEAR Height Stories
1990 770 54
1980 677 47
1990 428 28
1989 410 38
1966 371 29
1976 504 38
1974 1136 80
1991 695 52
1982 551 45
1986 550 40
1931 568 49
1979 504 33
1988 560 50
1973 512...
**R-STUDIO KNOWLEDGE REQUIRED***
PLEASE ANSWER THE FOLLOWING WITH ****R-STUDIO****
CODING- thank you so much!!
I am specifically look for the solution to part
***(h)**** and *****(i)***** below using R-Studio
code:
The data set in question
is:
YEAR Height Stories
1990 770 54
1980 677 47
1990 428 28
1989 410 38
1966 371 29
1976 504 38
1974 1136 80
1991 695 52
1982 551 45
1986 550 40
1931 568 49
1979 504 33
1988 560 50
1973 512...
can somebody please help me with the question quickly I really need help with this, choose a country and research population data in order to fill out the table below.
 2. Choose a country and research population data in order to fill out the table beloa. Copy the population numbers counted each five years, as shown in the data base, for the years from 1950 to 2000 . Add a column, \(t\), measuring years șince 1945 .b. What is the country you selected? In what part of the world is it? What is the magnitude of its population numbers? \(\left(100,000^{\circ} \mathrm{s}\right.\), millions, hundred millions, billions?) Is it growing or shrinking...
 Please provide with R codes! thank you!!
Data:
Question:
Data: 179 161 162 605557 155 60 158 56 172 57 191 60 179 57 163 58 Height (cm) Head Circumference (cm) 2. Draw at most 3 plots to visually describe your data. Is your response variable approximately Normal? 3. Numerically describe the centre, spread and any unusual points of your variables/data. 4. Fit and describe a simple linear regression model between head circumference and height. 5. Are the regression parameters...
Please provide with R codes! thank you!!
Data:
Question:
Data: 179 161 162 605557 155 60 158 56 172 57 191 60 179 57 163 58 Height (cm) Head Circumference (cm) 2. Draw at most 3 plots to visually describe your data. Is your response variable approximately Normal? 3. Numerically describe the centre, spread and any unusual points of your variables/data. 4. Fit and describe a simple linear regression model between head circumference and height. 5. Are the regression parameters...
 Do 2.3.4
Use the data "Orange" in R. You should include the r code as well as the output in your file, with appropriate answer to questions. Answer the following questions in your document 1. Fit a simple linear regression using "circumterence" as response and "age" as predictor. Is there a significant linear relationship between the two variables? State the null and alternative hypothesis, test statistic and p-value 2. Find which observation has the largest residual in absolute value) Give...
Do 2.3.4
Use the data "Orange" in R. You should include the r code as well as the output in your file, with appropriate answer to questions. Answer the following questions in your document 1. Fit a simple linear regression using "circumterence" as response and "age" as predictor. Is there a significant linear relationship between the two variables? State the null and alternative hypothesis, test statistic and p-value 2. Find which observation has the largest residual in absolute value) Give...
 Exercise 1. For this exercise use the bdims data set from the openintro package. Type ?bdims to read about this data set in the help menu. Of interest are the variables hgt (height in centimeters), wgt (weight in kilograms), and sex (dummy variable with 1-male, 0-female). Since ggplotO requires that a categorical variable be coded as a factor type in R, run the following code: library (openintro) bdíms$sex2 <-factor (bdins$sex, levels-c (0,1), labels=c('F', 'M')) (a) Use ggplot2 to make a...
 Need help with stats true or false questions
Decide (with short explanations) whether the following statements are true or false a) We consider the model y-Ao +A(z) +E. Let (-0.01, 1.5) be a 95% confidence interval for A In this case, a t-test with significance level 1% rejects the null hypothesis Ho : A-0 against a two sided alternative. b) Complicated models with a lot of parameters are better for prediction then simple models with just a few parameters c)...
Need help with stats true or false questions
Decide (with short explanations) whether the following statements are true or false a) We consider the model y-Ao +A(z) +E. Let (-0.01, 1.5) be a 95% confidence interval for A In this case, a t-test with significance level 1% rejects the null hypothesis Ho : A-0 against a two sided alternative. b) Complicated models with a lot of parameters are better for prediction then simple models with just a few parameters c)...
 For expert using R , I solve it but i need to figure out what
I got is correct or wrong. Thank you
# Simple Linear Regression and Polynomial Regression
# HW 2
#
# Read data from csv file
data <-
read.csv("C:\data\SweetPotatoFirmness.csv",header=TRUE,
sep=",")
head(data)
str(data)
# scatterplot of independent and dependent variables
plot(data$pectin,data$firmness,xlab="Pectin,
%",ylab="Firmness")
par(mfrow = c(2, 2)) # Split the plotting panel into a 2 x 2
grid
model <- lm(firmness ~ pectin , data=data)
summary(model)
anova(model)
plot(model)...
For expert using R , I solve it but i need to figure out what
I got is correct or wrong. Thank you
# Simple Linear Regression and Polynomial Regression
# HW 2
#
# Read data from csv file
data <-
read.csv("C:\data\SweetPotatoFirmness.csv",header=TRUE,
sep=",")
head(data)
str(data)
# scatterplot of independent and dependent variables
plot(data$pectin,data$firmness,xlab="Pectin,
%",ylab="Firmness")
par(mfrow = c(2, 2)) # Split the plotting panel into a 2 x 2
grid
model <- lm(firmness ~ pectin , data=data)
summary(model)
anova(model)
plot(model)...
 4. The anscombe data set in the datasets R package (should automatically be loaded) contains 4 pairs of response-explanatory variables. The pairs are xl-yl, x2-y2, x3-y3, and x4-y4 where x is the explanatory variable and y is the response variable. (a) Run 4 simple linear regression analyses (one on each of the 4 pairs) to verify that the regression output is exactly the same (up to numerical accuracy) b) For each pair, describe what is wrong (if anything) and use...
 **R-STUDIO KNOWLEDGE REQUIRED***
PLEASE ANSWER THE FOLLOWING WITH ****R-STUDIO****
CODING- thank you so much!!
I am specifically look for the solution to part
***(h)**** and *****(i)***** below using R-Studio
code:
The data set in question
is:
YEAR Height Stories
1990 770 54
1980 677 47
1990 428 28
1989 410 38
1966 371 29
1976 504 38
1974 1136 80
1991 695 52
1982 551 45
1986 550 40
1931 568 49
1979 504 33
1988 560 50
1973 512...
**R-STUDIO KNOWLEDGE REQUIRED***
PLEASE ANSWER THE FOLLOWING WITH ****R-STUDIO****
CODING- thank you so much!!
I am specifically look for the solution to part
***(h)**** and *****(i)***** below using R-Studio
code:
The data set in question
is:
YEAR Height Stories
1990 770 54
1980 677 47
1990 428 28
1989 410 38
1966 371 29
1976 504 38
1974 1136 80
1991 695 52
1982 551 45
1986 550 40
1931 568 49
1979 504 33
1988 560 50
1973 512...
Most questions answered within 3 hours.
-
The three key cash-related activities of a firm are
operational activities, non-current activities and financing
activities....
asked 34 minutes ago -
what statement accurately depicts the similarities in
requirements between payroll and human resources function
asked 2 hours ago -
Calculate the volume integral of the function T=z^2 over the
tetrahedron with corners (0,0,0), (1,0,0), (0,1,0),...
asked 4 hours ago -
I propose to you a game. You roll 2 dice. If the sum of the
numbers...
asked 5 hours ago -
Select the most likely lattice types for each of the following
salts: (a) BeF2; (b) CaO;...
asked 5 hours ago -
a
ball is thrown downward with velocity of 10m/s. calculate the final
velocity if it reaches...
asked 5 hours ago -
How many grams of ice at -15°C must be added to 705 grams of
water that...
asked 7 hours ago -
2. Balance sheet
The balance sheet provides a snapshot of the financial condition
of a company....
asked 7 hours ago -
In week 1 of the chemical equilibrium experiment, you and your
lab team will create a...
asked 8 hours ago -
Identify and describe five (5) characteristics of a good KM
measurement system. Be sure to include...
asked 8 hours ago -
What are at least five (5) workplace wellness best practices for
a successful wellness program? Explain...
asked 8 hours ago -
A pharmaceutical company is testing a new drug. Of the 110
people that received the drug,...
asked 8 hours ago