practice questions for a test. except the Prof never shared the answers to the practice test. please help
Homework Answers
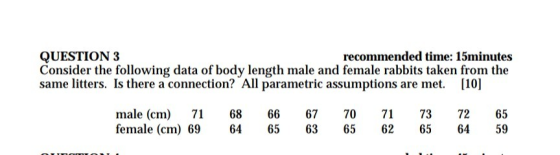
For checking connection of body length of male and female i use correlation
From that there are 0.4941178 Correlation i.e possitive correlation
That means there is positive relationship between body length male & female.
Yes there is connection between body length male and female.
An Male and female both variable follows normality
assumption.
Add Answer to:
practice questions for a test. except the Prof never
shared the answers to the practice test....
Consider the below matrixA, which you can copy and paste directly into Matlab.
Problem #1: Consider the below matrix A, which you can copy and paste directly into Matlab. The matrix contains 3 columns. The first column consists of Test #1 marks, the second column is Test # 2 marks, and the third column is final exam marks for a large linear algebra course. Each row represents a particular student.A = [36 45 75 81 59 73 77 73 73 65 72 78 65 55 83 73 57 78 84 31 60 83...
For the following data "Class Data: Heights by gender" Male: 69 72.5 71 70 69 66...
For the following data "Class Data: Heights by gender" Male: 69 72.5 71 70 69 66 65 72 73 67 71 69 68 Female: 65 63 62 63.5 68 65 64 64 62.75 68 Make back to back stem plots of heights. Compare the distributions with respect to height, with reference to center, spread and shape of the distribution.
The Excel attachment below contains the hiring salaries (in $1000) of 15 pairs of recent men...
The Excel attachment below contains the hiring salaries (in $1000) of 15 pairs of recent men and women MBA graduates. We wish to use a significance level of 0.01 to test the hypothesis that the starting salaries for male and female graduates are different. What is the P-value of the test? A. 0.009 B. 0.076 C. 0.038 D. 0.005 Men women 72 65 66 71 69 60 71 62 71 73 67 56 77 71 64 64 80 75 69...
3. Outliers: For the “Height in Inches” data, compute a z-score for each record and create...
3. Outliers: For the “Height in Inches” data, compute a z-score for each record and create a histogram of the transformed data (test different bin widths). What percentage of z-scores lie between -1 and 1? Between -2 and 2? Between -3 and 3? Do the data correspond to the expected features of a “symmetric-mound shaped distribution”? HEIGHT DATA 67 67 68 68 74 69 71 66 64 64 66 68 68 72 72 67 67 66 67 69 71...
Gender HeartRate male 70 male 71 male 74 male 80 male 73 male 75 male 82...
 Gender HeartRate
male 70
male 71
male 74
male 80
male 73
male 75
male 82
male 64
male 69
male 70
male 68
male 72
male 78
male 70
male 75
male 74
male 69
male 73
male 77
male 58
male 73
male 65
male 74
male 76
male 72
male 78
male 71
male 74
male 67
male 64
male 78
male 73
male 67
male 66
male 64
male 71
male 72
male 86
male 72...
Gender HeartRate
male 70
male 71
male 74
male 80
male 73
male 75
male 82
male 64
male 69
male 70
male 68
male 72
male 78
male 70
male 75
male 74
male 69
male 73
male 77
male 58
male 73
male 65
male 74
male 76
male 72
male 78
male 71
male 74
male 67
male 64
male 78
male 73
male 67
male 66
male 64
male 71
male 72
male 86
male 72...
estimate the average age at which multiple sclerosis patients were diagnosed with the condition for the...
estimate the average age at which multiple sclerosis patients were diagnosed with the condition for the first time in a given city. How big should the sample be? Define your procedures for this estimate (if necessary, set your own values of unknown parameters, based on statistical theory). In Table 1 you will find all ages of this patient population. 54 58 56 48 62 59 55 56 60 52 53 61 56 56 53 37 71 62 39 61 54...
4. Box-Plot: Create a box-plot for the “Car Mileage” and the “Height in Inches” data on...
4. Box-Plot: Create a box-plot for the “Car Mileage” and the “Height in Inches” data on separate graphs. Use Microsoft Excel to compute the essential features of the box-plot (Median, Quartiles, IQR, Outliers). You can create your box plots by hand on a separate sheet of graph paper. Be sure to indicate the key features of a box-plot on your graph, namely, the median, lower and upper quartiles, inner and outer fences and be sure to indicate outliers. Comment on...
Use the accompanying data set on the pulse rates (in beats per minute) of males to...
Use the accompanying data set on the pulse rates (in beats per minute) of males to complete parts (a) and (b) below. LOADING... Click the icon to view the pulse rates of males. a. Find the mean and standard deviation, and verify that the pulse rates have a distribution that is roughly normal. The mean of the pulse rates is 71.871.8 beats per minute. (Round to one decimal place as needed.) The standard deviation of the pulse rates is 12.212.2...
The female students in an undergraduate engineering core course at ASU self reported their heights to...
 The female students in an undergraduate engineering core course at ASU self reported their heights to the nearest inch. The data are below. Construct a histogram step-by-step for the female student height data. 65 66 64 66 63 67 63 66 64 68 67 61 67 65 62 65 70 69 63 69 61 65 67 69 67 63 69 65 68 68 68 66 63 64 65 68 70
In a study designed to measure various aspects of multicultural sensitivity, simple random samples of 15...
In a study designed to measure various aspects of multicultural sensitivity, simple random samples of 15 male and 15 female clinical psychologists were given several tests. On one of the tests, the two sets of sample scores were: Male Female 67 56 73 66 65 62 69 61 58 65 60 70 60 56 64 70 66 69 59 73 74 66 61 60 59 68 67 75 66 54 Do these scores indicate a difference between men and women with respect to this aspect of multicultural sensitivity? Begin by identifying a statement to be...
 Gender HeartRate
male 70
male 71
male 74
male 80
male 73
male 75
male 82
male 64
male 69
male 70
male 68
male 72
male 78
male 70
male 75
male 74
male 69
male 73
male 77
male 58
male 73
male 65
male 74
male 76
male 72
male 78
male 71
male 74
male 67
male 64
male 78
male 73
male 67
male 66
male 64
male 71
male 72
male 86
male 72...
Gender HeartRate
male 70
male 71
male 74
male 80
male 73
male 75
male 82
male 64
male 69
male 70
male 68
male 72
male 78
male 70
male 75
male 74
male 69
male 73
male 77
male 58
male 73
male 65
male 74
male 76
male 72
male 78
male 71
male 74
male 67
male 64
male 78
male 73
male 67
male 66
male 64
male 71
male 72
male 86
male 72...
 The female students in an undergraduate engineering core course at ASU self reported their heights to the nearest inch. The data are below. Construct a histogram step-by-step for the female student height data. 65 66 64 66 63 67 63 66 64 68 67 61 67 65 62 65 70 69 63 69 61 65 67 69 67 63 69 65 68 68 68 66 63 64 65 68 70
Most questions answered within 3 hours.
-
Given that many conflict are the result of different parties having
different interests, is it possible...
asked 2 minutes ago -
A 750 g block can slide uniformly along the horizontal track
when a string attached to...
asked 5 minutes ago -
In 2017, Juan entered into a contract to write a book. The
publisher advanced Juan $50,000,...
asked 18 minutes ago -
Determine the number of kinds of protons in each molecule (w/
respect to NMR spectroscopy). Drawing...
asked 29 minutes ago -
A jeweler whose near point is 68 cm from his eye uses a
magnifying glass as...
asked 27 minutes ago -
A company wants to determine how many units of each of two
products, A and B,...
asked 31 minutes ago -
The blood pressure of a person changes throughout the day.
Suppose the systolic blood pressure of...
asked 39 minutes ago -
A chemistry student desired to study sulfur. Sulfur exhibited
the following characteristics with oxygen:
(a) It...
asked 35 minutes ago -
An Atwood machine is constructed of a solid-disk frictionless
pulley of mass m3 and radius R....
asked 37 minutes ago -
what are the advantages of lanthanum hexaboride over tungsten
filament for electron emission
what is the...
asked 39 minutes ago -
Question 5
Your uncle offers to sell you his vintage Rolls Royce. He
suggests a payment...
asked 43 minutes ago -
Quality grading of beef products as Prime, Choice, Select. What
type of data?
A) ratio
B)...
asked 53 minutes ago