


Homework Answers
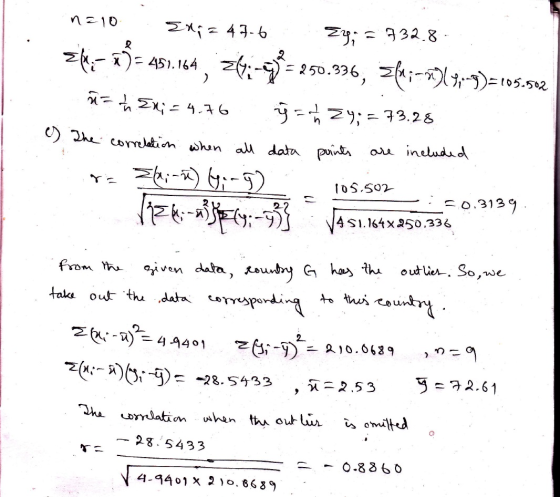
| Country | Birth (x) | Life Exp (y) | (x-x_)^2 | (y-y_)^2 | (x-x_)(y-y_) |
| A | 2.2 | 74.6 | 6.5536 | 1.7424 | -3.3792 |
| B | 1.7 | 75.6 | 9.3636 | 5.3824 | -7.0992 |
| C | 3.7 | 63.9 | 1.1236 | 87.9844 | 9.9428 |
| D | 1.5 | 79.6 | 10.6276 | 39.9424 | -20.6032 |
| E | 2.4 | 72.2 | 5.5696 | 1.1664 | 2.5488 |
| F | 2.9 | 67.4 | 3.4596 | 34.5744 | 10.9368 |
| G | 24.8 | 79.3 | 401.6016 | 36.2404 | 120.6408 |
| H | 3.7 | 68.1 | 1.1236 | 26.8324 | 5.4908 |
| I | 2.1 | 75.3 | 7.0756 | 4.0804 | -5.3732 |
| J | 2.6 | 76.8 | 4.6656 | 12.3904 | -7.6032 |
| Total | 47.6 | 732.8 | 451.164 | 250.336 | 105.502 |
After delating the outlier observation
| Country | Birth (x) | Life Exp (y) | (x-x_)^2 | (y-y_)^2 | (x-x_)(y-y_) |
| A | 2.2 | 74.6 | 0.1089 | 3.9601 | -0.6567 |
| B | 1.7 | 75.6 | 0.6889 | 8.9401 | -2.4817 |
| C | 3.7 | 63.9 | 1.3689 | 75.8641 | -10.1907 |
| D | 1.5 | 79.6 | 1.0609 | 48.8601 | -7.1997 |
| E | 2.4 | 72.2 | 0.0169 | 0.1681 | 0.0533 |
| F | 2.9 | 67.4 | 0.1369 | 27.1441 | -1.9277 |
| H | 3.7 | 68.1 | 1.3689 | 20.3401 | -5.2767 |
| I | 2.1 | 75.3 | 0.1849 | 7.2361 | -1.1567 |
| J | 2.6 | 76.8 | 0.0049 | 17.5561 | 0.2933 |
| Total | 22.8 | 653.5 | 4.9401 | 210.0689 | -28.5433 |

Add Answer to:
HI ISLI UCIUI-Liedleu quesLIUI Country Data from 10 countries can be used to examine the association...
Might we be able to predict life expectancies from birthrates? Below are bivariate data giving birthrate...
 Might we be able to predict life expectancies from birthrates? Below are bivariate data giving birthrate and life expectancy information for each of twelve countries. For each of the countries, both x, the number of births per one thousand people in the population, and y, the female life expectancy (in years), are given. Also shown are the scatter plot for the data and the least squares regression line. The equation for this line is 9 = = 82.46 -0.48x Birthrate,...
Suppose that you have in your possession bivariate data giving birthrate and life expectancy information for...
 Suppose that you have in your possession bivariate data giving birthrate and life expectancy information for a random sample of 15 countries. For each of the countries, the data give both x, the number of births per one thousand people in the country's population, and y, the country's female life expectancy in years. The least squares regression equation computed from your data is y = 84.06 -0.51x. Suppose that you're predicting the female life expectancy for a country whose birthrate...
The table below shows the life expectancy for an individual born in the United States in...
The table below shows the life expectancy for an individual born in the United States in certain years. Year of Birth Life Expectancy CHART W NUMBERS IS BELOW Part (a) Decide which variable should be the independent variable and which should be the dependent variable. A)Independent: year of birth; Dependent: life expectancy Independent: life expectancy; B) Dependent: year of birth Incorrect: Your answer is incorrect. Part (b) Draw a scatter plot of the ordered pairs. Part (c) Calculate the least...
Use the given data to find the equation of the regression line. Examine the scatterplot and...
Use the given data to find the equation of the regression line. Examine the scatterplot and identify a characteristic of the data that is ignored by the regression line. x 11 8 11 8 12 13 7 4 12 6 5 y 7.58 6.69 13.24 7.32 7.62 8.52 6.09 5.15 8.13 6.15 5.52 Find the equation of the regression line. (Round the constant two decimal places as needed. Round the coefficient to three decimal places as needed.)
1. 2. 3. Use the given data to find the equation of the regression line. Examine...
 1.
2.
3.
Use the given data to find the equation of the regression line. Examine the scatterplot and identify a characteristic of the data that is ignored by the regression line. X 5 14 13.31 13 13.66 12 13.74 10 13.05 9 12.30 4 4.31 6 8.34 8 11.25 11 13.54 7 9.94 y 6.46 = 3.00 + 0.80 (Round to two decimal places as needed.) The data show the chest size and weight of several bears. Find the...
1.
2.
3.
Use the given data to find the equation of the regression line. Examine the scatterplot and identify a characteristic of the data that is ignored by the regression line. X 5 14 13.31 13 13.66 12 13.74 10 13.05 9 12.30 4 4.31 6 8.34 8 11.25 11 13.54 7 9.94 y 6.46 = 3.00 + 0.80 (Round to two decimal places as needed.) The data show the chest size and weight of several bears. Find the...
B. Predict the number of software millionaire birthdays that will occur in a decade where the...
 B. Predict the number of software
millionaire birthdays that will occur in a decade where the total
number of births in this country is 35 million. ( round to 2
decimal places as needed)
C. Fit a simple linear regression model relating number (y) of
software millionaire birthdays in a decade to number (x) of CEO
birthdays. give the least squares prediction equation. (
round to 2 decimal places as needed)
D. Predict the number of software millionaire birthdays that
will...
B. Predict the number of software
millionaire birthdays that will occur in a decade where the total
number of births in this country is 35 million. ( round to 2
decimal places as needed)
C. Fit a simple linear regression model relating number (y) of
software millionaire birthdays in a decade to number (x) of CEO
birthdays. give the least squares prediction equation. (
round to 2 decimal places as needed)
D. Predict the number of software millionaire birthdays that
will...
The data on the right represent the number of the muliple-delivery birth (three or more habe...
 The data on the right represent the number of the muliple-delivery birth (three or more habe in particule year for women 15 to 5 years old. Use the date to complete parte a through the below Nawrot to Age 97 35 TA 155 la) Determine the probably thw a randomly selected multiple for women 15-54 years old involved a mother 30 to 39 years old PC3039-0 Type an integer or decimal rounded to the decimal places as needed (b) Determine...
Use the given data to find the equation of the regression ine. Examine the scatterplot and...
 Use the given data to find the equation of the regression ine. Examine the scatterplot and identity a characteristic of the data that is ignored by the regression ine. 10 8 13 10 12 13 5 4 11 8 6 y 7.44 6.64 12.51 6.86 7.57 8.69 6.19 5.14 8.5 6.63 5.7 Create a soutterplot of the data. Choose the correct graph below. OA ов. Oc. OD. 25+ 20 a 20 151 10 15 10 15 10 10 G G...
32.) the data on the right represent the number of live multiple delivery births (3 or...
 32.) the data on the right represent the number of live multiple
delivery births (3 or more babies) in a particular year for women
15 to 54 years old. use data to complete parts a through d
The data on the right represent the number of the multiple delivery birthe (three or more babies) na particular you for women 16 to 5 years old. Use the date to complete parts (4) through (4) below Number of Multiple Birth Age 15-19...
32.) the data on the right represent the number of live multiple
delivery births (3 or more babies) in a particular year for women
15 to 54 years old. use data to complete parts a through d
The data on the right represent the number of the multiple delivery birthe (three or more babies) na particular you for women 16 to 5 years old. Use the date to complete parts (4) through (4) below Number of Multiple Birth Age 15-19...
Data Table The scatterplot to the right and the data table below show, for 2008 cars,...
 Data Table The scatterplot to the right and the data table below show, for 2008 cars, the carbon footprint (tons of CO2 per year) vs. highway mileage for 20 family sedans. a) The correlation is - 0.740. Describe the association. b) Are the assumptions and conditions met for finding a correlation? c) Using technology, find the correlation of the data when the car with the lowest carbon footprint and highest highway mpg is not included with the others. Explain why...
 Might we be able to predict life expectancies from birthrates? Below are bivariate data giving birthrate and life expectancy information for each of twelve countries. For each of the countries, both x, the number of births per one thousand people in the population, and y, the female life expectancy (in years), are given. Also shown are the scatter plot for the data and the least squares regression line. The equation for this line is 9 = = 82.46 -0.48x Birthrate,...
 Suppose that you have in your possession bivariate data giving birthrate and life expectancy information for a random sample of 15 countries. For each of the countries, the data give both x, the number of births per one thousand people in the country's population, and y, the country's female life expectancy in years. The least squares regression equation computed from your data is y = 84.06 -0.51x. Suppose that you're predicting the female life expectancy for a country whose birthrate...
 1.
2.
3.
Use the given data to find the equation of the regression line. Examine the scatterplot and identify a characteristic of the data that is ignored by the regression line. X 5 14 13.31 13 13.66 12 13.74 10 13.05 9 12.30 4 4.31 6 8.34 8 11.25 11 13.54 7 9.94 y 6.46 = 3.00 + 0.80 (Round to two decimal places as needed.) The data show the chest size and weight of several bears. Find the...
1.
2.
3.
Use the given data to find the equation of the regression line. Examine the scatterplot and identify a characteristic of the data that is ignored by the regression line. X 5 14 13.31 13 13.66 12 13.74 10 13.05 9 12.30 4 4.31 6 8.34 8 11.25 11 13.54 7 9.94 y 6.46 = 3.00 + 0.80 (Round to two decimal places as needed.) The data show the chest size and weight of several bears. Find the...
 B. Predict the number of software
millionaire birthdays that will occur in a decade where the total
number of births in this country is 35 million. ( round to 2
decimal places as needed)
C. Fit a simple linear regression model relating number (y) of
software millionaire birthdays in a decade to number (x) of CEO
birthdays. give the least squares prediction equation. (
round to 2 decimal places as needed)
D. Predict the number of software millionaire birthdays that
will...
B. Predict the number of software
millionaire birthdays that will occur in a decade where the total
number of births in this country is 35 million. ( round to 2
decimal places as needed)
C. Fit a simple linear regression model relating number (y) of
software millionaire birthdays in a decade to number (x) of CEO
birthdays. give the least squares prediction equation. (
round to 2 decimal places as needed)
D. Predict the number of software millionaire birthdays that
will...
 The data on the right represent the number of the muliple-delivery birth (three or more habe in particule year for women 15 to 5 years old. Use the date to complete parte a through the below Nawrot to Age 97 35 TA 155 la) Determine the probably thw a randomly selected multiple for women 15-54 years old involved a mother 30 to 39 years old PC3039-0 Type an integer or decimal rounded to the decimal places as needed (b) Determine...
 Use the given data to find the equation of the regression ine. Examine the scatterplot and identity a characteristic of the data that is ignored by the regression ine. 10 8 13 10 12 13 5 4 11 8 6 y 7.44 6.64 12.51 6.86 7.57 8.69 6.19 5.14 8.5 6.63 5.7 Create a soutterplot of the data. Choose the correct graph below. OA ов. Oc. OD. 25+ 20 a 20 151 10 15 10 15 10 10 G G...
 32.) the data on the right represent the number of live multiple
delivery births (3 or more babies) in a particular year for women
15 to 54 years old. use data to complete parts a through d
The data on the right represent the number of the multiple delivery birthe (three or more babies) na particular you for women 16 to 5 years old. Use the date to complete parts (4) through (4) below Number of Multiple Birth Age 15-19...
32.) the data on the right represent the number of live multiple
delivery births (3 or more babies) in a particular year for women
15 to 54 years old. use data to complete parts a through d
The data on the right represent the number of the multiple delivery birthe (three or more babies) na particular you for women 16 to 5 years old. Use the date to complete parts (4) through (4) below Number of Multiple Birth Age 15-19...
 Data Table The scatterplot to the right and the data table below show, for 2008 cars, the carbon footprint (tons of CO2 per year) vs. highway mileage for 20 family sedans. a) The correlation is - 0.740. Describe the association. b) Are the assumptions and conditions met for finding a correlation? c) Using technology, find the correlation of the data when the car with the lowest carbon footprint and highest highway mpg is not included with the others. Explain why...
Most questions answered within 3 hours.
-
Break-even time. Hampton Corporation’s research
and development department is presenting a proposal for new product
research....
asked 51 seconds ago -
At Lake Itasca in Minnesota, the Mississippi river is only 25.0
feet wide. If you are...
asked 1 minute ago -
A 2.0 μF parallel-plate air-filled capacitor is connected
across a 10 V battery.
(a) Determine the...
asked 12 minutes ago -
Write in Python This program:
1. Correct the compute_cells_state function which receives as
parameter an array...
asked 2 minutes ago -
1. What is the difference in the output layer between a neural
network used for classification,...
asked 10 minutes ago -
ECO
2013 &
asked 16 minutes ago -
Insight refers to:
a.
Adaptive decision-making
b.
Credibility and trustworthness
c.
Understanding of one's problems
d....
asked 22 minutes ago -
Explain the differences between rights and permissions within
Windows. Define the principle of least privilege and...
asked 30 minutes ago -
A solid, frictionless cylindrical reel of mass M=5.00kg and
radius R=0.55m is used to draw water...
asked 32 minutes ago -
how do radio waves get emitted from Jupiter?
- do they come from radiation from planet...
asked 33 minutes ago -
The test statistic used in the F test for the equality of two
variances is calculated...
asked 44 minutes ago -
How does neutralisation of IL-6 trans-signaling affect the
autoimmune disease and inflammation? What if the trans-signaling...
asked 35 minutes ago