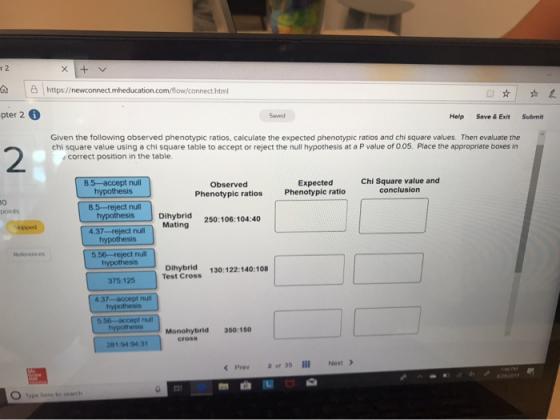
Given the following observed phenotypic ratios, calculate the expected phenotypic ratios and chi square values. Then evaluate the chi square value using a chi square table to accept or reject the null hypothesis at a P value of 0.05. Place the appropriate boxes in correct position in the table
Homework Answers

Problem 1
Null hypothesis: The observed values are not deviating from the 9:3:3:1 ratio.
|
Observed values (O) |
250 |
106 |
104 |
40 |
500 |
|
Exptected Ratio (ER) |
9 |
3 |
3 |
1 |
16 |
|
Exprected Values (E) |
281.25 |
93.75 |
93.75 |
31.25 |
|
|
Deviation (O-E) |
-31.25 |
12.25 |
10.25 |
8.75 |
|
|
D^2 |
976.5625 |
150.0625 |
105.0625 |
76.5625 |
|
|
D^2/E |
3.472222 |
1.600667 |
1.120667 |
2.45 |
8.643556 |
|
X^2 |
8.643556 |
||||
|
Degrees of freedom |
4-1=3 |
Inference: The calculated chisquar value i.e. 8.6 is greater than the table value i.e.7.82 at 3 DF and 0.05 probability, hence the null hypothesis is rejected.
Problem 2
Null hypothesis: The observed values are not deviating from the 1:1:1:1 ratio.
|
Observed values (O) |
130 |
122 |
140 |
108 |
500 |
|
Exptected Ratio (ER) |
1 |
1 |
1 |
1 |
4 |
|
Exprected Values (E) |
125 |
125 |
125 |
125 |
|
|
Deviation (O-E) |
5 |
-3 |
15 |
-17 |
|
|
D^2 |
25 |
9 |
225 |
289 |
|
|
D^2/E |
0.2 |
0.072 |
1.8 |
2.312 |
4.384 |
|
X^2 |
4.384 |
||||
|
Degrees of freedom |
4-1=3 |
` |
Inference: The calculated chisquar value i.e. 4.38 is less than the table value i.e.7.82 at 3 DF and 0.05 probability, hence the null hypothesis is accepted.
Problem 3
Null hypothesis: The observed values are not deviating from the 3:1 ratio.
|
Observed values (O) |
350 |
150 |
500 |
|
Exptected Ratio (ER) |
3 |
1 |
4 |
|
Exprected Values (E) |
375 |
125 |
|
|
Deviation (O-E) |
-25 |
25 |
|
|
D^2 |
625 |
625 |
|
|
D^2/E |
1.666667 |
5 |
6.666667 |
|
X^2 |
6.67 |
||
|
Degrees of freedom |
- |
1 |
Inference: The calculated chisquar value i.e. 6.67 is greater than the table value i.e. 6.67 at 1 DF and 0.05 probability, hence the null hypothesis is rejected.
Add Answer to:
Given the following observed phenotypic ratios, calculate the expected phenotypic ratios and chi square values.
for these Table S. Best-of-Fit Chi-Square Calculations for Sex Ratios. The observed numbers families can be...
 for these Table S. Best-of-Fit Chi-Square Calculations for Sex Ratios. The observed numbers families can be found on this supplement page 6. Deviation (O-E/E Observed Expected 497 Deviatic Results O-E All boys 3 B:1G 2 B:2G 1B:3G All girls G99 Total e. Degrees of Freedom- d. Range of probability that deviations are due to chance- e. Accept or reject hypothesis? 5. Next, determine whether the overall ratio of boys to girls in the above data is consistent with the hypothesis...
A distribution and the observed frequencies of the values of a variable from a simple random sample of the population are provided below. Use the chi-square goodness-of-fit test to decide, at the spe...
 A distribution and the observed frequencies of the values of a variable from a simple random sample of the population are provided below. Use the chi-square goodness-of-fit test to decide, at the specified significance level, whether the distribution of the variable differs from the given distribution Distribution: 0.1875, 0.1875, Observed frequencies: 16, 20, 24, 36 Significance level 0.05 0.3125, 0.3125 Determine the null and alternative hypotheses. Choose the correct answer below. OA. H: The distribution of the variable differs from...
Value: 2 For many students, calculating the chi square value is the most challenging part of conducting a chi square test so it is important to practice. Consider the following information An F1 tall...
 Value: 2 For many students, calculating the chi square value is the most challenging part of conducting a chi square test so it is important to practice. Consider the following information An F1 tall, round seed pea plant is crossed with a dwarf, wrinkled seed pea plant. The following offspring are observed: Tall, round: 510 Tall, wrinkled: 495 Dwarf, round: 490 Dwarf, wrinkled: 505 a. What is the expected phenotype ratio? ## or ####, depending on what you think the...
The type of plant favored by deer is shown in the following table. Volunteers observed the...
The type of plant favored by deer is shown in the following table. Volunteers observed the feeding habits of a random sample of 320 deer. Use a 0.05 level of significance to test the claim that the natural distribution of browse fits the deer feeding pattern. Type of Browse Plant Composition in Study Area Observed Number of Deer Feeding on Plant Sage Brush 32% 102 Rabbit Brush 38% 125 Salt Brush 12% 43 Service Berry 10% 27 Other 8% 23...
The table to the right contains observed values and expected values in parentheses for two categorical...
 The table to the right contains observed values and expected values in parentheses for two categorical variables, X and Y, where variable X has three categories and variable Y has two categories. Use the table to complete parts (a) and (b) below. Y1 X1 X3 32 45 49 (32.72) (47.34) (45.94) 15 23 17 (14.28) 20.66) (20.06) Y2 (a) Compute the value of the chi-square test statistic. x=(Round to three decimal places as needed.) (b) Test the hypothesis that X...
(If any are cut off answer what you can see) 3A) 3b) 3C) 3D) You are...
 (If any are cut off answer what you can see)
3A)
3b)
3C)
3D)
You are conducting a multinomial Goodness of Fit hypothesis test for the claim that the 4 categories occur with the following frequencies: H:PA = 0.25; PB = 0.4; Pc = 0.1; PD 0.25 Complete the table. Report all answers accurate to three decimal places. Observed Expected Category Residual Frequency Frequency А 17 B 57 с 8 D 23 What is the chi-square test-statistic for this data?...
(If any are cut off answer what you can see)
3A)
3b)
3C)
3D)
You are conducting a multinomial Goodness of Fit hypothesis test for the claim that the 4 categories occur with the following frequencies: H:PA = 0.25; PB = 0.4; Pc = 0.1; PD 0.25 Complete the table. Report all answers accurate to three decimal places. Observed Expected Category Residual Frequency Frequency А 17 B 57 с 8 D 23 What is the chi-square test-statistic for this data?...
55 sn car sn cart sn* car sn+Car+ 200 TABLE 5.2 Critical Chi-Square Values Values 0.99...
 55 sn car sn cart sn* car sn+Car+ 200 TABLE 5.2 Critical Chi-Square Values Values 0.99 0.90 0.50 0.10 0.05 0.01 0.001 Degrees of Freedom Values w - 0.02 0.45 2.71 0.02 0.21 1.39 4.61 0.11 0.58 2.37 6.25 0.30 1.06 3.36 778 0.55 1.61 4.35 9.24 3.84 6.64 10.83 5.99 9.21 13.82 7.81 11.35 16.27 9.49 13.28 18.47 11.07 15.09 20.52 In Drosophila, singed bristles (sn) and carnation eyes (car) are both caused by recessive X-linked alleles. The wild-type...
What does it mean if the Chi-square test statistic has a value of zero? There is...
 What does it mean if the Chi-square test statistic has a value of zero? There is an error in the calculations as the test statistic must be positive. We will reject the null hypothesis. The test is right-tailed so that the result is inconclusive. All of the observed values equal the expected values for the corresponding cell.
(If some are cut off just answer what you can see) 2A) 2B) 2C) 2D) You...
 (If some are cut off just answer what you can see)
2A)
2B)
2C)
2D)
You are conducting a multinomial hypothesis test (a = 0.05) for the claim that all 5 categories are equally likely to be selected. Complete the table. Observed Expected Squared Category Pearson Frequency Frequency Residual A 25 B 14 с 9 D 22 E 20 Report all answers accurate to three decimal places. But retain unrounded numbers for future calculations. What is the chi-square test-statistic for...
(If some are cut off just answer what you can see)
2A)
2B)
2C)
2D)
You are conducting a multinomial hypothesis test (a = 0.05) for the claim that all 5 categories are equally likely to be selected. Complete the table. Observed Expected Squared Category Pearson Frequency Frequency Residual A 25 B 14 с 9 D 22 E 20 Report all answers accurate to three decimal places. But retain unrounded numbers for future calculations. What is the chi-square test-statistic for...
use problem above to answer Complete the following chi-square problems. (Show all work!!) In the cross...
 use problem above to answer
Complete the following chi-square problems. (Show all work!!) In the cross AaBb x AaBb O-E (O-E) (O-E)?/E 311 105 1. Phenotype A-B- A-bb aaB- aabb Totals 25 calculated X2= mith, Beatty and Ware 7/14 revised by for Fall 2015, BIOL 251 Genetics Lab Manual, Benedictine Univ page 3 a. What are your null and alternative hypotheses? b. How many degrees of freedom? c. What is your table X2 value? d. What is your region of...
use problem above to answer
Complete the following chi-square problems. (Show all work!!) In the cross AaBb x AaBb O-E (O-E) (O-E)?/E 311 105 1. Phenotype A-B- A-bb aaB- aabb Totals 25 calculated X2= mith, Beatty and Ware 7/14 revised by for Fall 2015, BIOL 251 Genetics Lab Manual, Benedictine Univ page 3 a. What are your null and alternative hypotheses? b. How many degrees of freedom? c. What is your table X2 value? d. What is your region of...
 for these Table S. Best-of-Fit Chi-Square Calculations for Sex Ratios. The observed numbers families can be found on this supplement page 6. Deviation (O-E/E Observed Expected 497 Deviatic Results O-E All boys 3 B:1G 2 B:2G 1B:3G All girls G99 Total e. Degrees of Freedom- d. Range of probability that deviations are due to chance- e. Accept or reject hypothesis? 5. Next, determine whether the overall ratio of boys to girls in the above data is consistent with the hypothesis...
 A distribution and the observed frequencies of the values of a variable from a simple random sample of the population are provided below. Use the chi-square goodness-of-fit test to decide, at the specified significance level, whether the distribution of the variable differs from the given distribution Distribution: 0.1875, 0.1875, Observed frequencies: 16, 20, 24, 36 Significance level 0.05 0.3125, 0.3125 Determine the null and alternative hypotheses. Choose the correct answer below. OA. H: The distribution of the variable differs from...
 Value: 2 For many students, calculating the chi square value is the most challenging part of conducting a chi square test so it is important to practice. Consider the following information An F1 tall, round seed pea plant is crossed with a dwarf, wrinkled seed pea plant. The following offspring are observed: Tall, round: 510 Tall, wrinkled: 495 Dwarf, round: 490 Dwarf, wrinkled: 505 a. What is the expected phenotype ratio? ## or ####, depending on what you think the...
 The table to the right contains observed values and expected values in parentheses for two categorical variables, X and Y, where variable X has three categories and variable Y has two categories. Use the table to complete parts (a) and (b) below. Y1 X1 X3 32 45 49 (32.72) (47.34) (45.94) 15 23 17 (14.28) 20.66) (20.06) Y2 (a) Compute the value of the chi-square test statistic. x=(Round to three decimal places as needed.) (b) Test the hypothesis that X...
 (If any are cut off answer what you can see)
3A)
3b)
3C)
3D)
You are conducting a multinomial Goodness of Fit hypothesis test for the claim that the 4 categories occur with the following frequencies: H:PA = 0.25; PB = 0.4; Pc = 0.1; PD 0.25 Complete the table. Report all answers accurate to three decimal places. Observed Expected Category Residual Frequency Frequency А 17 B 57 с 8 D 23 What is the chi-square test-statistic for this data?...
(If any are cut off answer what you can see)
3A)
3b)
3C)
3D)
You are conducting a multinomial Goodness of Fit hypothesis test for the claim that the 4 categories occur with the following frequencies: H:PA = 0.25; PB = 0.4; Pc = 0.1; PD 0.25 Complete the table. Report all answers accurate to three decimal places. Observed Expected Category Residual Frequency Frequency А 17 B 57 с 8 D 23 What is the chi-square test-statistic for this data?...
 55 sn car sn cart sn* car sn+Car+ 200 TABLE 5.2 Critical Chi-Square Values Values 0.99 0.90 0.50 0.10 0.05 0.01 0.001 Degrees of Freedom Values w - 0.02 0.45 2.71 0.02 0.21 1.39 4.61 0.11 0.58 2.37 6.25 0.30 1.06 3.36 778 0.55 1.61 4.35 9.24 3.84 6.64 10.83 5.99 9.21 13.82 7.81 11.35 16.27 9.49 13.28 18.47 11.07 15.09 20.52 In Drosophila, singed bristles (sn) and carnation eyes (car) are both caused by recessive X-linked alleles. The wild-type...
 What does it mean if the Chi-square test statistic has a value of zero? There is an error in the calculations as the test statistic must be positive. We will reject the null hypothesis. The test is right-tailed so that the result is inconclusive. All of the observed values equal the expected values for the corresponding cell.
 (If some are cut off just answer what you can see)
2A)
2B)
2C)
2D)
You are conducting a multinomial hypothesis test (a = 0.05) for the claim that all 5 categories are equally likely to be selected. Complete the table. Observed Expected Squared Category Pearson Frequency Frequency Residual A 25 B 14 с 9 D 22 E 20 Report all answers accurate to three decimal places. But retain unrounded numbers for future calculations. What is the chi-square test-statistic for...
(If some are cut off just answer what you can see)
2A)
2B)
2C)
2D)
You are conducting a multinomial hypothesis test (a = 0.05) for the claim that all 5 categories are equally likely to be selected. Complete the table. Observed Expected Squared Category Pearson Frequency Frequency Residual A 25 B 14 с 9 D 22 E 20 Report all answers accurate to three decimal places. But retain unrounded numbers for future calculations. What is the chi-square test-statistic for...
 use problem above to answer
Complete the following chi-square problems. (Show all work!!) In the cross AaBb x AaBb O-E (O-E) (O-E)?/E 311 105 1. Phenotype A-B- A-bb aaB- aabb Totals 25 calculated X2= mith, Beatty and Ware 7/14 revised by for Fall 2015, BIOL 251 Genetics Lab Manual, Benedictine Univ page 3 a. What are your null and alternative hypotheses? b. How many degrees of freedom? c. What is your table X2 value? d. What is your region of...
use problem above to answer
Complete the following chi-square problems. (Show all work!!) In the cross AaBb x AaBb O-E (O-E) (O-E)?/E 311 105 1. Phenotype A-B- A-bb aaB- aabb Totals 25 calculated X2= mith, Beatty and Ware 7/14 revised by for Fall 2015, BIOL 251 Genetics Lab Manual, Benedictine Univ page 3 a. What are your null and alternative hypotheses? b. How many degrees of freedom? c. What is your table X2 value? d. What is your region of...
Most questions answered within 3 hours.
-
Are adult gamers less likely to use a gaming console (Xbox,
PlayStation, Wii, etc...) than teen...
asked 48 minutes ago -
The University of
Texas recently reported that 43% of college students aged 18-24
would spend their...
asked 59 minutes ago -
The length of stay at a specific emergency department in
Phoenix, Arizona, in 2009 had a...
asked 15 minutes ago -
. Please give the mechanism for this type of problem. Step by
Step
The toxin that...
asked 18 minutes ago -
If you have a 1M stock solution and you want to dilute 1 :10
with water,...
asked 20 minutes ago -
In a load instruction, the effective address is obtained by
A) Retriving the address from a...
asked 20 minutes ago -
Use the following information to answer this question.
Windswept, Inc. 2017 Income Statement ($ in millions)...
asked 21 minutes ago -
A mutual fund salesperson has arranged to call on four people
tomorrow. Based on past experience...
asked 54 minutes ago -
Let the RV Y has the pdf
f ( y ) = 6 y ( 1...
asked 1 hour ago -
Question 12
Where should a copy of a private key should be placed so it is...
asked 23 minutes ago -
What is the entropy change to the surroundings when 1 mol of ice
melts in someone's...
asked 43 minutes ago -
Pt1
An electrochemical cell is set up at 25°C based on the overall
reaction represented by...
asked 49 minutes ago