The following are the entrance exam scores (percentages) of 15 randomly chosen students:
65 81 55 90 85
95 77 62 89 83
74 83 62 68 83
a. Calculate the range of the scores.
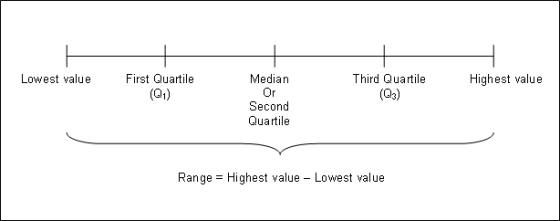
b. Determine the first, second and third quartiles.
c. Calculate the percentile rank of a person who has a score of 62%.

d. What is the score of a person who is in the 80th percentile of the data?
e. Calculate the mean, median, and mode of the data.
Homework Answers


Add Answer to:
The following are the entrance exam scores (percentages) of 15
randomly chosen students:
65 81 55...
Determine if the following statements are true or false. a. The third quartile separates the lowest...
 Determine if the following statements are true or false. a. The third quartile separates the lowest 25% of the data from the highest 75% of the data. b. The second quartile is the same as the median. c. The first quartile is the same as the 25th percentile. d. The five-number summary consists of the following values: (minimum, first quartile, mean, third quartile, maximum)
The following data were collected as part of a study of coffee consumption among medical students....
 The following data were collected as part of a study of coffee consumption among medical students. The following reflect cups per day consumed: First, put the data in order from lowest to highest: 0, 1, 2, 2, 3, 4, 6, 8 This will help you to find the median and the quartiles! 1) Compute the sample mean and round to ane decimal place (see page 100 2) Compute the sample median and round to one decimal place (see page 88)....
The following data were collected as part of a study of coffee consumption among medical students....
 The following data were collected as part of a study of coffee consumption among medical students. The following reflect cups per day consumed: First, put the data in order from lowest to highest: 0, 1, 2, 2, 3, 4, 6, 8 This will help you to find the median and the quartiles 1) Compute the sample mean and round to one decimal place (see page 100), 2) Compute the sample median and round to one decimal place (see page 88)...
The following data were collected as part of a study of coffee consumption among medical students....
The following data were collected as part of a study of coffee consumption among medical students. The following reflect cups per day consumed: 3 4 6 8 2 1 0 2 First, put the data in order from lowest to highest: 0, 1, 2, 2, 3, 4, 6, 8 This will help you to find the median and the quartiles! 1) Compute the sample mean and round to one decimal place (see page 100). ____ 2) Compute the sample median...
Use the following collection of 30 test scores: 100, 65, 67, 61, 62, 70, 75, 73,...
Use the following collection of 30 test scores: 100, 65, 67, 61, 62, 70, 75, 73, 88, 77, 83, 79,95, 79, 8102, 86, 87, 87, 91, 87, 89, 92, 90, 99, 87, 72, 93, 79, 52 a. Construct a frequency distribution table using 6 classes: include classes, frequencies, class marks, class boundaries, relative frequencies, and relative percentages. b. Find the mean to the nearest tenth and sample standard deviation to the nearest tenth. c. Use the results from part b...
7. Use the following collection of 30 test scores: 100, 65, 67, 61, 62, 70, 75,...
 7. Use the following collection of 30 test scores: 100, 65, 67, 61, 62, 70, 75, 73, 88, 77, 83, 79, 95, 79, 80, 102, 86, 87, 87, 91, 87, 89, 92, 90, 99, 87, 72, 93, 79,52 a. Construct a frequency distribution table using 6 classes: include classes, frequencies, class marks, class boundaries, relative frequencies and relative percentages. b. Find the mean to the nearest tenth and sample standard deviation to the nearest tenth. c. Use the results from...
show work 7. Use the following collection of 30 test scores: 100, 65, 67, 61, 62,...
 show work
7. Use the following collection of 30 test scores: 100, 65, 67, 61, 62, 70, 75, 73, 88, 77, 83, 79, 95, 79, 80, 102, 86, 87, 87, 91, 87, 89, 92, 90, 99, 87, 72, 93, 79, 52 a. Construct a frequency distribution table using 6 classes: include classes, frequencies, class marks, class boundaries, relative frequencies and relative percentages. b. Find the mean to the nearest tenth and sample standard deviation to the nearest tenth. 6. Use...
show work
7. Use the following collection of 30 test scores: 100, 65, 67, 61, 62, 70, 75, 73, 88, 77, 83, 79, 95, 79, 80, 102, 86, 87, 87, 91, 87, 89, 92, 90, 99, 87, 72, 93, 79, 52 a. Construct a frequency distribution table using 6 classes: include classes, frequencies, class marks, class boundaries, relative frequencies and relative percentages. b. Find the mean to the nearest tenth and sample standard deviation to the nearest tenth. 6. Use...
Determine if the following statements are true or false. a. The third quartile separates the lowest...
 Determine if the following statements are true or false. a. The third quartile separates the lowest 25% of the data from the highest 75% of the data. b. The second quartile is the same as the median. C. The first quartile is the same as the 25th percentile. d. The five-number summary consists of the following values: (minimum, first quartile, mean, third quartile, maximum) Let V be the event that a computer contains a virus, and let w be the...
 Determine if the following statements are true or false. a. The third quartile separates the lowest 25% of the data from the highest 75% of the data. b. The second quartile is the same as the median. c. The first quartile is the same as the 25th percentile. d. The five-number summary consists of the following values: (minimum, first quartile, mean, third quartile, maximum)
 Determine if the following statements are true or false. a. The third quartile separates the lowest 25% of the data from the highest 75% of the data. b. The second quartile is the same as the median. c. The first quartile is the same as the 25th percentile. d. The five-number summary consists of the following values: (minimum, first quartile, mean, third quartile, maximum)
 The following data were collected as part of a study of coffee consumption among medical students. The following reflect cups per day consumed: First, put the data in order from lowest to highest: 0, 1, 2, 2, 3, 4, 6, 8 This will help you to find the median and the quartiles! 1) Compute the sample mean and round to ane decimal place (see page 100 2) Compute the sample median and round to one decimal place (see page 88)....
 The following data were collected as part of a study of coffee consumption among medical students. The following reflect cups per day consumed: First, put the data in order from lowest to highest: 0, 1, 2, 2, 3, 4, 6, 8 This will help you to find the median and the quartiles 1) Compute the sample mean and round to one decimal place (see page 100), 2) Compute the sample median and round to one decimal place (see page 88)...
 7. Use the following collection of 30 test scores: 100, 65, 67, 61, 62, 70, 75, 73, 88, 77, 83, 79, 95, 79, 80, 102, 86, 87, 87, 91, 87, 89, 92, 90, 99, 87, 72, 93, 79,52 a. Construct a frequency distribution table using 6 classes: include classes, frequencies, class marks, class boundaries, relative frequencies and relative percentages. b. Find the mean to the nearest tenth and sample standard deviation to the nearest tenth. c. Use the results from...
 7. Use the following collection of 30 test scores: 100, 65, 67, 61, 62, 70, 75, 73, 88, 77, 83, 79, 95, 79, 80, 102, 86, 87, 87, 91, 87, 89, 92, 90, 99, 87, 72, 93, 79,52 a. Construct a frequency distribution table using 6 classes: include classes, frequencies, class marks, class boundaries, relative frequencies and relative percentages. b. Find the mean to the nearest tenth and sample standard deviation to the nearest tenth. c. Use the results from...
 show work
7. Use the following collection of 30 test scores: 100, 65, 67, 61, 62, 70, 75, 73, 88, 77, 83, 79, 95, 79, 80, 102, 86, 87, 87, 91, 87, 89, 92, 90, 99, 87, 72, 93, 79, 52 a. Construct a frequency distribution table using 6 classes: include classes, frequencies, class marks, class boundaries, relative frequencies and relative percentages. b. Find the mean to the nearest tenth and sample standard deviation to the nearest tenth. 6. Use...
show work
7. Use the following collection of 30 test scores: 100, 65, 67, 61, 62, 70, 75, 73, 88, 77, 83, 79, 95, 79, 80, 102, 86, 87, 87, 91, 87, 89, 92, 90, 99, 87, 72, 93, 79, 52 a. Construct a frequency distribution table using 6 classes: include classes, frequencies, class marks, class boundaries, relative frequencies and relative percentages. b. Find the mean to the nearest tenth and sample standard deviation to the nearest tenth. 6. Use...
 Determine if the following statements are true or false. a. The third quartile separates the lowest 25% of the data from the highest 75% of the data. b. The second quartile is the same as the median. C. The first quartile is the same as the 25th percentile. d. The five-number summary consists of the following values: (minimum, first quartile, mean, third quartile, maximum) Let V be the event that a computer contains a virus, and let w be the...
Most questions answered within 3 hours.
-
The blues made its way into many kinds of music. Eric Clapton,
The Beatles, and Elvis...
asked 5 minutes ago -
If you’re standing at the bottom of a hill and asked to evaluate
it while being...
asked 1 hour ago -
1. Which region has taken the lead in the world of
e-waste handling?
a) European Union...
asked 54 minutes ago -
A 8.15- g bullet from a 9-mm pistol has a velocity of 366.0 m/s.
It strikes...
asked 2 hours ago -
The outstanding bonds of Alpha Extracts have a yield to maturity
of 7.4 percent and a...
asked 2 hours ago -
The Problem: The Case of the Harmonizing Vacations
Your CEO is exploring partnering with a European...
asked 3 hours ago -
A chemical equation is balanced by adding coefficients in front
of some formulas so that the...
asked 3 hours ago -
From the literature (reference your sources): What are the
lattice parameters of calcite and aragonite? Why...
asked 4 hours ago -
Your system is rejecting the question am asking which is
preceded by a case study. It...
asked 4 hours ago -
3. On January 2, 2000, Larry creates a trust with himself as
trustee. Larry as trustee...
asked 4 hours ago -
A member of the volleyball team spikes the ball. During this
process, she changes the velocity...
asked 4 hours ago -
Are adult gamers less likely to use a gaming console (Xbox,
PlayStation, Wii, etc...) than teen...
asked 5 hours ago