Calculate the mean, median, and standard deviation for the total number of candies (per bag). Construct...
- Calculate the mean, median, and standard deviation for the total number of candies (per bag).
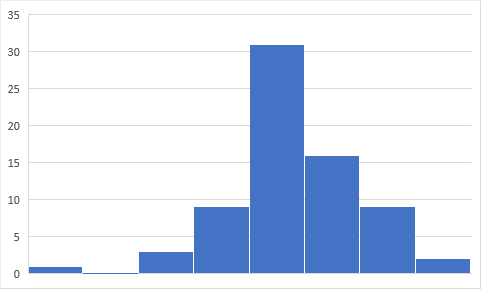
- Construct a histogram of the total number of candies (per bag).
- Use the z-score method to identify any potential outliers and outliers.
- Assume the total number of candies is normally distributed, calculate the probability that a randomly sampled bag has at least 55 candies in a bag.
- If a random sample of 50 bags is selected, find the probability that the mean number of candies in a bag is at least 56 candies. Assume the total number of candies is normally distributed.
- Assume the total number of candies is normally distributed, find a 95% confidence interval for the mean total number of candies.
- Construct a probability distribution for the colors of the M&M® candies sample:
Color Probability
Blue
Orange
Green
Yellow
Red
Brown
- Mars Inc. indicates that the M&M® colors are distributed as follows:
Color Proportion
Blue 24%
Orange 20%
Green 16%
Yellow 14%
Red 13%
Brown 13%
Conduct a hypothesis test (α=0.05) to see if the proportion of blue is the same as the company states. Specify the hypothesis of the test, critical value, test statistic, p-value, decision (reject the null/ fail to reject the null), and the conclusion of what the decision means.
- At the 0.01 level of significance, test if the true mean total number of candies (per bag) is greater than 54. Specify the hypotheses of the test, critical value, test statistic, p-value, decision (reject the null/ fail to reject the null), and the conclusion of what the decision means.
| Bag | Blue | Orange | Green | Yellow | Red | Brown | Total Number of Candies | |
| 1 | 7 | 23 | 9 | 11 | 4 | 6 | 60 | |
| 2 | 16 | 16 | 4 | 7 | 9 | 4 | 56 | |
| 3 | 14 | 14 | 3 | 10 | 5 | 11 | 57 | |
| 4 | 13 | 14 | 7 | 8 | 8 | 6 | 56 | |
| 5 | 18 | 12 | 7 | 10 | 5 | 7 | 59 | |
| 6 | 12 | 9 | 11 | 9 | 8 | 8 | 57 | |
| 7 | 15 | 16 | 6 | 6 | 6 | 8 | 57 | |
| 8 | 15 | 17 | 8 | 4 | 6 | 7 | 57 | |
| 9 | 12 | 14 | 10 | 5 | 10 | 7 | 58 | |
| 10 | 16 | 16 | 7 | 5 | 6 | 2 | 52 | |
| 11 | 18 | 10 | 6 | 9 | 9 | 3 | 55 | |
| 12 | 21 | 12 | 7 | 6 | 6 | 4 | 56 | |
| 13 | 18 | 12 | 9 | 5 | 7 | 2 | 53 | |
| 14 | 18 | 10 | 7 | 5 | 8 | 5 | 53 | |
| 15 | 18 | 16 | 7 | 4 | 7 | 4 | 56 | |
| 16 | 19 | 6 | 7 | 4 | 8 | 11 | 55 | |
| 17 | 15 | 15 | 7 | 6 | 9 | 3 | 55 | |
| 18 | 21 | 10 | 7 | 9 | 6 | 4 | 57 | |
| 19 | 20 | 8 | 5 | 4 | 13 | 6 | 56 | |
| 20 | 15 | 15 | 7 | 2 | 8 | 10 | 57 | |
| 21 | 13 | 11 | 11 | 3 | 15 | 5 | 58 | |
| 22 | 14 | 12 | 7 | 11 | 8 | 3 | 55 | |
| 23 | 11 | 15 | 6 | 10 | 7 | 6 | 55 | |
| 24 | 12 | 16 | 7 | 8 | 7 | 7 | 57 | |
| 25 | 15 | 16 | 6 | 5 | 8 | 6 | 56 | |
| 26 | 15 | 10 | 8 | 6 | 12 | 7 | 58 | |
| 27 | 20 | 14 | 5 | 4 | 5 | 8 | 56 | |
| 28 | 18 | 13 | 11 | 6 | 6 | 5 | 59 | |
| 29 | 12 | 13 | 11 | 4 | 9 | 8 | 57 | |
| 30 | 8 | 16 | 10 | 8 | 7 | 8 | 57 | |
| 31 | 15 | 10 | 9 | 9 | 6 | 5 | 54 | |
| 32 | 22 | 8 | 5 | 8 | 4 | 10 | 57 | |
| 33 | 14 | 12 | 5 | 11 | 9 | 5 | 56 | |
| 34 | 11 | 16 | 10 | 3 | 7 | 9 | 56 | |
| 35 | 13 | 17 | 5 | 3 | 12 | 4 | 54 | |
| 36 | 10 | 20 | 6 | 2 | 8 | 7 | 53 | |
| 37 | 10 | 12 | 10 | 6 | 11 | 6 | 55 | |
| 38 | 15 | 11 | 4 | 4 | 8 | 11 | 53 | |
| 39 | 14 | 16 | 3 | 7 | 8 | 7 | 55 | |
| 40 | 14 | 10 | 8 | 6 | 12 | 5 | 55 | |
| 41 | 16 | 17 | 10 | 5 | 5 | 3 | 56 | |
| 42 | 19 | 15 | 5 | 5 | 5 | 7 | 56 | |
| 43 | 13 | 14 | 6 | 5 | 7 | 10 | 55 | |
| 44 | 17 | 16 | 4 | 7 | 7 | 10 | 61 | |
| 45 | 13 | 12 | 11 | 4 | 10 | 6 | 56 | |
| 46 | 19 | 13 | 4 | 5 | 9 | 4 | 54 | |
| 47 | 17 | 15 | 6 | 8 | 7 | 4 | 57 | |
| 48 | 11 | 12 | 6 | 6 | 7 | 9 | 51 | |
| 49 | 19 | 12 | 5 | 2 | 7 | 12 | 57 | |
| 50 | 11 | 15 | 7 | 3 | 10 | 1 | 47 | |
| 51 | 15 | 13 | 5 | 8 | 8 | 9 | 58 | |
| 52 | 15 | 17 | 4 | 3 | 10 | 10 | 59 | |
| 53 | 15 | 16 | 4 | 3 | 5 | 11 | 54 | |
| 54 | 16 | 12 | 7 | 6 | 8 | 9 | 58 | |
| 55 | 13 | 17 | 8 | 4 | 9 | 6 | 57 | |
| 56 | 18 | 20 | 4 | 3 | 5 | 5 | 55 | |
| 57 | 14 | 18 | 5 | 7 | 8 | 6 | 58 | |
| 58 | 12 | 16 | 7 | 5 | 5 | 9 | 54 | |
| 59 | 10 | 13 | 7 | 10 | 7 | 8 | 55 | |
| 60 | 16 | 14 | 6 | 10 | 7 | 4 | 57 | |
| 61 | 8 | 21 | 3 | 5 | 10 | 9 | 56 | |
| 62 | 17 | 17 | 7 | 4 | 9 | 3 | 57 | |
| 63 | 7 | 16 | 8 | 7 | 10 | 8 | 56 | |
| 64 | 15 | 20 | 2 | 3 | 6 | 10 | 56 | |
| 65 | 14 | 19 | 5 | 5 | 5 | 9 | 57 | |
| 66 | 15 | 11 | 8 | 6 | 10 | 5 | 55 | |
| 67 | 14 | 13 | 9 | 9 | 4 | 2 | 51 | |
| 68 | 15 | 15 | 5 | 7 | 8 | 5 | 55 | |
| 69 | 16 | 15 | 5 | 8 | 4 | 8 | 56 | |
| 70 | 16 | 7 | 7 | 10 | 10 | 6 | 56 | |
| 71 | 13 | 16 | 10 | 8 | 2 | 6 | 55 | |
| 72 | 11 | 11 | 5 | 10 | 8 | 9 | 54 |
Homework Answers
Calculate the mean, median, and standard deviation for the total number of candies (per bag).
| Mean | 55.79167 |
| Median | 56 |
| Standard Deviation | 2.142379 |
Construct a histogram of the total number of candies (per bag).
Use the z-score method to identify any potential outliers and outliers.
2 outliers.
Assume the total number of candies is normally distributed, calculate the probability that a randomly sampled bag has at least 55 candies in a bag.
| 55.000 | hypothesized value |
| 55.792 | mean Total Number of Candies |
| 2.142 | std. dev. |
| 0.252 | std. error |
| 72 | n |
| 71 | df |
| 3.136 | t |
| .0012 | p-value (one-tailed, upper) |
Probability = 0.0012.
Add Answer to:
Calculate the mean, median, and standard deviation for the
total number of candies (per bag).
Construct...
Bag Blue Orange Green Yellow Red Brown Total Number of Candies 1 9 13 14 10...
Bag Blue Orange Green Yellow Red Brown Total Number of Candies 1 9 13 14 10 7 7 60 2 13 10 6 9 9 8 55 3 13 12 4 10 9 6 54 4 16 13 8 6 6 8 57 5 10 10 12 5 15 4 56 6 9 18 3 6 12 12 60 7 11 13 6 15 8 6 59 8 12 18 5 9 6 5 55 9 12 10 8 15...
We will be constructing confidence intervals for the proportion of each color as well as the...
We will be constructing confidence intervals for the proportion of each color as well as the mean number of candies per bag. You will use the methods of 9.1 for the proportions and 9.2 for the mean. Remember that you can use Excel (or your calculator) to do many of the preliminary calculations 1). Construct a 95% Confidence Interval for the mean total number of candies (large samples). (2). Construct a 95% Confidence Interval for the proportion of blue M&Ms®...
blockpy python review 16 processing json files second pic is the report.json file data BlockPy: Review 16) Process JSON The given file contains JSON data. Use the data associated with the "Employ...
 blockpy python review 16 processing json files
second pic is the report.json file data
BlockPy: Review 16) Process JSON The given file contains JSON data. Use the data associated with the "Employees" key (a list inside of a dictionary inside of a dictionary inside of a dictionary) to plot the distribution of employees. Note: You cannot embed the contents of the file directly in your program. Use the appropriate file handling style to access the data in the file. Note:...
blockpy python review 16 processing json files
second pic is the report.json file data
BlockPy: Review 16) Process JSON The given file contains JSON data. Use the data associated with the "Employees" key (a list inside of a dictionary inside of a dictionary inside of a dictionary) to plot the distribution of employees. Note: You cannot embed the contents of the file directly in your program. Use the appropriate file handling style to access the data in the file. Note:...
For each variable of interest, do the following: 1. Find the mean, five-number summary, range, variance,...
For each variable of interest, do the following: 1. Find the mean, five-number summary, range, variance, and standard deviation. Display these numbers in a format that is easy to understand. 2. For each variable of interest, use its five-number summary to construct a boxplot. Each boxplot must be constructed horizontally, and must be accompanied by a brief descriptive paragraph that assesses whether the data appear to be symmetrical, left-skewed, or right-skewed. Construct a 95% confidence interval for the mean μ...
Total #of men's per Bag/ it of people 53 SS 56 54 57 58 S 8...
 Total #of men's per Bag/ it of people 53 SS 56 54 57 58 S 8 13 in 3 2 1 59 Activity 14 [2 points): After checking many bags of M&M's, an M&M enthusiast believes that there should be about 58 plain M&M's per 1.69 oz. bag. Test this claim using the class data at the 0.05 level of significance. Hoi Activity 15 [2 points): Create a 95% confidence interval for the mean number of M&M's per bag, using...
1. The data set on sheet #1 gives data on GPA category and number of hours studied. Construct com...
1. The data set on sheet #1 gives data on GPA category and number of hours studied. Construct comparative box plots of the data first GPA category. Then conduct two-sample t-test on the data for whether GPA category influences the number of hours studied. Be prepared to explain the results of the test and the meaning of the boxplots and how they relate to each other. Then redo the analysis by replacing the ordinal GPA category with a numerical dummy...
A snack size bag of m&ms candies is opened. Inside, there are 12 red candies, 12...
A snack size bag of m&ms candies is opened. Inside, there are 12 red candies, 12 blue, 7 green, 13 brown, 3 orange, and 10 yellow. Three candies are pulled from the bag in succession, without replacement. What probability that the first two candies drawn are green and the third is red? 12+12+7+13+3+10=57 7/57x6/56x12/55 =504/175560 How did they get 3/1045 as the final answer?
Suppose a binary tree data (in tiny written size) is stored in an array (A) as...
Suppose a binary tree data (in tiny written size) is stored in an array (A) as given below and root is placed at “0”index. Note the array indices are in larger written size (0 to 74). Show the traversal data of the given tree for a) In-Order Traversal b) Post Order Traversal A 0 1 2 3 4 5 6 7 8 9 10 11 12 13 14 3 28 13 36 15 9 22 44 7 10 75 33 19 15...
 blockpy python review 16 processing json files
second pic is the report.json file data
BlockPy: Review 16) Process JSON The given file contains JSON data. Use the data associated with the "Employees" key (a list inside of a dictionary inside of a dictionary inside of a dictionary) to plot the distribution of employees. Note: You cannot embed the contents of the file directly in your program. Use the appropriate file handling style to access the data in the file. Note:...
blockpy python review 16 processing json files
second pic is the report.json file data
BlockPy: Review 16) Process JSON The given file contains JSON data. Use the data associated with the "Employees" key (a list inside of a dictionary inside of a dictionary inside of a dictionary) to plot the distribution of employees. Note: You cannot embed the contents of the file directly in your program. Use the appropriate file handling style to access the data in the file. Note:...
 Total #of men's per Bag/ it of people 53 SS 56 54 57 58 S 8 13 in 3 2 1 59 Activity 14 [2 points): After checking many bags of M&M's, an M&M enthusiast believes that there should be about 58 plain M&M's per 1.69 oz. bag. Test this claim using the class data at the 0.05 level of significance. Hoi Activity 15 [2 points): Create a 95% confidence interval for the mean number of M&M's per bag, using...
Most questions answered within 3 hours.
-
Your system is rejecting the question am asking which is
preceded by a case study. It...
asked 1 minute from now -
A member of the volleyball team spikes the ball. During this
process, she changes the velocity...
asked 2 minutes ago -
Are adult gamers less likely to use a gaming console (Xbox,
PlayStation, Wii, etc...) than teen...
asked 55 minutes ago -
The University of
Texas recently reported that 43% of college students aged 18-24
would spend their...
asked 1 hour ago -
The length of stay at a specific emergency department in
Phoenix, Arizona, in 2009 had a...
asked 22 minutes ago -
. Please give the mechanism for this type of problem. Step by
Step
The toxin that...
asked 25 minutes ago -
If you have a 1M stock solution and you want to dilute 1 :10
with water,...
asked 27 minutes ago -
In a load instruction, the effective address is obtained by
A) Retriving the address from a...
asked 27 minutes ago -
Use the following information to answer this question.
Windswept, Inc. 2017 Income Statement ($ in millions)...
asked 28 minutes ago -
A mutual fund salesperson has arranged to call on four people
tomorrow. Based on past experience...
asked 1 hour ago -
Let the RV Y has the pdf
f ( y ) = 6 y ( 1...
asked 1 hour ago -
Question 12
Where should a copy of a private key should be placed so it is...
asked 31 minutes ago