To answer the next question, use the following graph showing the domestic demand and supply curves for a specific standardized product in a particular nation.

If the world price for this product is $0.50, this nation will experience a domestic
Multiple Choice
-
shortage of 160 units, which it will meet with 160 units of imports.
-
shortage of 160 units, which will increase the domestic price to $1.60.
-
surplus of 160 units, which it will export.
-
surplus of 160 units, which will reduce the world price to $1.00.
Use the following figure showing the domestic demand and supply curves for product B in a hypothetical economy to answer the next question.
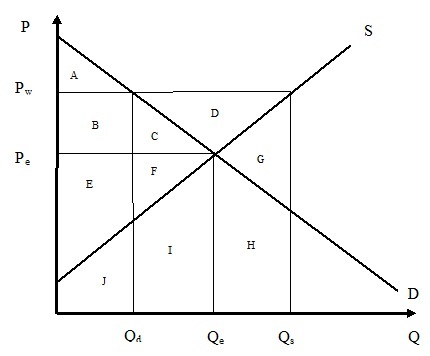
After trade, at a world price of Pw , consumer surplus equals area(s)
Multiple Choice
-
A + B + C + D.
-
A + B + C.
-
A + D.
-
A.
The productivity table given below shows how many bushels of either wheat or rice can be produced in India and US with 1 unit of input.
| Country | Wheat (bushels) | Rice (bushels) |
| India | 10 | 10 |
| Canada | 40 | 20 |
To achieve gains from specialization and trade
Multiple Choice
-
India should export rice to US and import American wheat.
-
India should export wheat to US and import American rice.
-
US should produce both wheat and rice and not trade with India.
-
India cannot offer any benefits to US from trading with her.
Homework Answers
1. Ans: shortage of 160 units, which it will meet with 160 units of imports.
Explanation:
At a price of $0.50, domestic demand is 290 and domestic supply is 130. So, there is a shortage of 160 which the country can import.
2. Ans: A
Explanation:
After trade, at a world price of Pw , consumer surplus equals area A.
3. Ans: India should export rice to US and import American wheat.
Explanation:
India's opportunity cost of producing 1 bushel of wheat = 10 / 10 = 1 bushel of rice and the opportunity cost of producing 1 bushel of rice = 10 / 10 = 1 bushel of wheat.
Canada's opportunity cost of producing 1 bushel of wheat = 20 / 40 = 0.5 bushel of rice and the opportunity cost of producing 1 bushel of rice = 40 / 20 = 2 bushel of wheat.
As we know, a country has comparative advantage in production of the goods which it can produce at lower opportunity cost than other country.
From the above calculation we found that, India has comparative advantage in production of Rice and Canada has comparative advantage in production of Wheat.
Thus, India should export rice to US and import American wheat.
Add Answer to:
To answer the next question, use the following graph showing the
domestic demand and supply curves...
Use the following figure showing the domestic demand and supply curves for product B in a...
 Use the following figure showing the domestic demand and supply curves for product B in a hypothetical economy to answer the next question. P. After trade, at a world price of Pw.the net gain of producer surplus equals area(s) Multiple Choice A-B-C D. D.
The following graph shows the domestic demand and domestic supply curves for lemons In Bolivia.
 Consider the Bolivian market for lemons. The following graph shows the domestic demand and domestic supply curves for lemons In Bolivia. Suppose Bolivia's government currently does not allow International trade In lemons. Use the black point (plus symbol) to Indicate the equilibrium price of a ton of lemons and the equilibrium quantity of lemons in Bolivia in the absence of International trade. Then, use the green triangle (triangle symbol) to shade the area representing consumer surplus In equilibrium. Finally, use the purple...
The following graph shows the domestic demand and domestic supply curves for tangerines in Panama. Suppose...
 The following graph shows the domestic demand and domestic supply curves for tangerines in Panama. Suppose Panama's government currently does not allow international trade in tangerines. Use the black point (plus symbol) to indicate the equilibrium price of a ton of tangerines and the equilibrium quantity of tangerines in Panama in the absence of international trade. Then, use the green triangle (triangle symbol) to shade the area representing consumer surplus in equilibrium. Finally, use the purple triangle (diamond symbol) to...
The following graph shows the domestic demand and domestic supply curves for lemons in New Zealand.
 The following graph shows the domestic demand and domestic supply curves for lemons in New Zealand. Suppose New Zealand's government currently does not allow international trade in lemons Use the black point (plus symbol) to indicate the equilibrium price of a ton of lemons and the equilibrium quantity of lemons in New Zealand in the absence of international trade. Then, use the green triangle (triangle symbol) to shade the area representing consumer surplus in equilibrium. Finally, use the purple triangle (diamond...
The following graph shows the domestic demand and domestic supply curves for soybeans in Venezuela
 Consider the Venezuelan market for soybeans. The following graph shows the domestic demand and domestic supply curves for soybeans in Venezuela. Suppose Venezuela's government currently does not allow international trade in soybeans. Use the black point (plus symbol) to indicate the equilibrium price of a ton of soybeans and the equilibrium quantity of soybeans in Venezuela in the absence of international trade. Then, use the green triangle (triangle symbol) to shade the area representing consumer surplus in equilibrium. Finally, use the purple...
Consider the Sudanese market for tangerines The following graph shows the domestic demand and domestic supply...
 Consider the Sudanese market for tangerines The following graph shows the domestic demand and domestic supply curves for tangerines in Sudan. Suppose Sudan's government currently does not allow international trade in tangerines Use the black point (plus symbol) to indicate the equilibrium price of a ton of tangerines and the equilibrium quantity of tangerines in Sudan in the absence of international trade. Then, use the green triangle (triangle symbol) to shade the area representing consumer surplus in equilibrium. Finally, use...
Home's Domestic Demand and supply curves for shoes are D = 500-10P and S = 300+20P....
Home's Domestic Demand and supply curves for shoes are D = 500-10P and S = 300+20P. Foreign's domestic demand and supply curves for the same type of shoes are D = 1000-10P and S = 200 + 40P. Problem 2.1 (3 points each). (a) Find the autarky price and quantity for each country. If the countries trade, which country will export shoes? (b) Derive algebraically the import demand and export supply functions. Find the price and volume of trade with...
Consider the Colombian market for soybeans. The following graph shows the domestic demand and domestic supply...
 Consider the Colombian market for soybeans. The following graph shows the domestic demand and domestic supply curves for soybeans in Colombia. Suppose Colombia's government currently does not allow international trade in soybeans. Use the black point (plus symbol) to indicate the equilibrium price of a ton of soybeans and the equilibrium quantity of soybeans in Colombia in the absence of international trade. Then, use the green triangle (triangle symbol) to shade the area representing consumer surplus in equilibrium. Finally, use...
The following graph shows the domestic demand and domestic supply curves for lemons in New Zealand.
 5. Welfare effects of free trade in an exporting country Consider the New Zealand market for lemons. The following graph shows the domestic demand and domestic supply curves for lemons in New Zealand. Suppose New Zealand's government currently does not allow the international trade in lemons. Use the black point (plus symbol) to indicate the equilibrium price of a ton of lemons and the equilibrium quantity of lemons in New Zealand in the absence of international trade. Then, use the green point (triangle...
Consider the Guatemalan market for tangerines. The following graph shows the domestic demand and domestic supply...
 Consider the Guatemalan market for tangerines. The following graph shows the domestic demand and domestic supply curves for tangerines in Guatemala. Suppose Guatemala's government currently does not allow international trade in tangerines Use the black point (plus symbol) to indicate the equilibrium price of a ton of tangerines and the equilibrium quantity of tangerines in Guatemala in the absence of international trade. Then, use the green triangle (triangle symbol) to shade the area representing consumer surplus in equilibrium. Finally, use...
 Use the following figure showing the domestic demand and supply curves for product B in a hypothetical economy to answer the next question. P. After trade, at a world price of Pw.the net gain of producer surplus equals area(s) Multiple Choice A-B-C D. D.
 The following graph shows the domestic demand and domestic supply curves for tangerines in Panama. Suppose Panama's government currently does not allow international trade in tangerines. Use the black point (plus symbol) to indicate the equilibrium price of a ton of tangerines and the equilibrium quantity of tangerines in Panama in the absence of international trade. Then, use the green triangle (triangle symbol) to shade the area representing consumer surplus in equilibrium. Finally, use the purple triangle (diamond symbol) to...
 Consider the Sudanese market for tangerines The following graph shows the domestic demand and domestic supply curves for tangerines in Sudan. Suppose Sudan's government currently does not allow international trade in tangerines Use the black point (plus symbol) to indicate the equilibrium price of a ton of tangerines and the equilibrium quantity of tangerines in Sudan in the absence of international trade. Then, use the green triangle (triangle symbol) to shade the area representing consumer surplus in equilibrium. Finally, use...
 Consider the Colombian market for soybeans. The following graph shows the domestic demand and domestic supply curves for soybeans in Colombia. Suppose Colombia's government currently does not allow international trade in soybeans. Use the black point (plus symbol) to indicate the equilibrium price of a ton of soybeans and the equilibrium quantity of soybeans in Colombia in the absence of international trade. Then, use the green triangle (triangle symbol) to shade the area representing consumer surplus in equilibrium. Finally, use...
 Consider the Guatemalan market for tangerines. The following graph shows the domestic demand and domestic supply curves for tangerines in Guatemala. Suppose Guatemala's government currently does not allow international trade in tangerines Use the black point (plus symbol) to indicate the equilibrium price of a ton of tangerines and the equilibrium quantity of tangerines in Guatemala in the absence of international trade. Then, use the green triangle (triangle symbol) to shade the area representing consumer surplus in equilibrium. Finally, use...
Most questions answered within 3 hours.
-
Which statement is not true about welfare in Canada?
A.Benefits typically vary based on one's ability...
asked 21 minutes ago -
Please help me with FLOWCHART and UML diagram for class,
thank you!
#include <iostream>
#include <fstream>...
asked 1 hour ago -
3. Describe the “logic circuit” of the Lac operon. Which
proteins are bound or not to...
asked 1 hour ago -
Ayesha’s adjusted gross income is $60,000 in 2019. She donated a
piece of artwork with a...
asked 1 hour ago -
For Dijkstra’s shortest path algorithm:
a. Give the Big-O time for Dijkstra’s shortest path algorithm
and...
asked 1 hour ago -
Phosphorus violates the 'octet rule' in biological molecules,
forming more covalent bonds than expected based on...
asked 1 hour ago -
A 1.3 eV electron has a 10-4 probability of tunneling
through a 2.4 eV potential barrier....
asked 1 hour ago -
What is the one ingredient that is common to being successful
with all stakeholders?
profit
trust...
asked 1 hour ago -
Write an assembly language 32 bit program that reads in lines of
text by a .txt...
asked 1 hour ago -
what is the density ( in g/L) of hydrogen gas at 29 degrees C and a...
asked 1 hour ago -
5-6. You are considering three investment alternatives for some
spare cash: Old Reliable Corporation stock (A1),...
asked 1 hour ago -
Problem 16-02
Receivables Investment
Medwig Corporation has a DSO of 45 days. The company averages
$7,250...
asked 2 hours ago