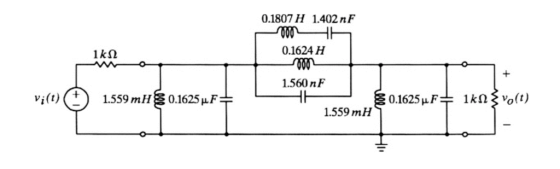
Using Matlab, plot the magnitude and phase of the transfer function (vo/vi) vs. frequency range 1-100 kHz. Use log scale for the frequency axis, dB scale for the magnitude axis, and degrees for the phase axis. Note dB = 20log10(vo/vi). The 10 stands for base 10. I need help writing a MATLAB code to output this plot and also coming up with the vo/vi function itself.
Homework Answers


Add Answer to:
Using Matlab, plot the magnitude and phase of the transfer
function (vo/vi) vs. frequency range 1-100...
21 Vi Z2 Vo Figure 1 1. Ref: Figure 1. Let Z1 L (an inductor), Z2 - R (a resistor). Vi Calculate the magnitude and phase of the transfer function H(w) Figure 1 T 2. Repeat #1 with L = 100 mH, R 1kΩ....
 21 Vi Z2 Vo Figure 1 1. Ref: Figure 1. Let Z1 L (an inductor), Z2 - R (a resistor). Vi Calculate the magnitude and phase of the transfer function H(w) Figure 1 T 2. Repeat #1 with L = 100 mH, R 1kΩ. a) Plot the frequency response in dB* on a both on a linear scale and then a log scale from ω-1 to 100,000,000 rad/sec with points every decade (1 b) 1,000 etc). 10 100 Plot the...
Plot or sketch the magnitude vs. frequency and the phase vs. frequency curves in a linear or log ...
 Plot or sketch the magnitude vs. frequency and the phase vs.
frequency curves in a linear or log scale.
Indicate if the circuit is a low pass, high pass, band pass or
band reject filter.
We were unable to transcribe this image1 C1 R2 C2 Vout in
1 C1 R2 C2 Vout in
Plot or sketch the magnitude vs. frequency and the phase vs.
frequency curves in a linear or log scale.
Indicate if the circuit is a low pass, high pass, band pass or
band reject filter.
We were unable to transcribe this image1 C1 R2 C2 Vout in
1 C1 R2 C2 Vout in
1. (a) sketch the Bode magnitude and phase plots of a transfer function T(W) = Vo(w)...
 1. (a) sketch the Bode magnitude and phase plots of a transfer function T(W) = Vo(w) given Wo = 27x1oʻrad/s. Vi (w) (l+ges/wo2 g (6) Calculate the half-power or 3-dB Cut-off frequency of the above transfer function, and the phase LT(W) at the 3-dB cut-off frequency.
Simulation For each filter mentioned in the following cases, first simulate the circuit using Multisim. You can get a plot of the transfer function that is called the Bode plot. From the right toolba...
 Simulation For each filter mentioned in the following cases, first simulate the circuit using Multisim. You can get a plot of the transfer function that is called the Bode plot. From the right toolbar, select "Bode Plotter". Change initial (I) and final (F) frequencies to 1Hz and 200 KHz, respectively. Use a Voltage AC source as the input signal. You do not need to change any parameter from voltage AC source. Connect "Bode Plotter" to input and output of your...
For the circuit shown in the figure above: Obtain an expression for H() Vo/Vi in standard form Generate spectral plots for the magnitude and phase of H (w), given that R-100Ω, L-0.1 mH, and C-1 μF De...
 For the circuit shown in the figure above: Obtain an expression for H() Vo/Vi in standard form Generate spectral plots for the magnitude and phase of H (w), given that R-100Ω, L-0.1 mH, and C-1 μF Determine the cutoff frequency we and the slope of the magnitude (in dB) when wwc >1
For the circuit shown in the figure above: Obtain an expression for H() Vo/Vi in standard form Generate spectral plots for the magnitude and phase of H (w),...
For the circuit shown in the figure above: Obtain an expression for H() Vo/Vi in standard form Generate spectral plots for the magnitude and phase of H (w), given that R-100Ω, L-0.1 mH, and C-1 μF Determine the cutoff frequency we and the slope of the magnitude (in dB) when wwc >1
For the circuit shown in the figure above: Obtain an expression for H() Vo/Vi in standard form Generate spectral plots for the magnitude and phase of H (w),...
For each filter mentioned in the following cases, first simulate the circuit using Multisim. You can get a plot of the transfer function that is called the Bode plot. From the right toolbar, select &...
 For each filter mentioned in the following cases, first simulate the circuit using Multisim. You can get a plot of the transfer function that is called the Bode plot. From the right toolbar, select "Bode Plotter". Change initial (I) and final (F frequencies to 1Hz and 200 KHz, respectively. Use a Voltage AC source as the input signal. You do not need to change any parameter from voltage AC source Connect "Bode Plotter" to input and output of your circuit...
The circuit above has the following parameters:
 The circuit above has the following parameters: R=55 Ohm, C=1.5 uF ("u"=micro), L1=3 mH, L2=4 mH; Using MATLAB (or equivalent tool) generate the transfer function H = Vo/Vi magnitude MdB(f) and Phase(f) frequency dependencies in the frequency range from 100 Hz to 12000 Hz. Define the Magntude plot of the transfer function by entering f (Hz) and M (dB) points. Do not enter units.Define the Phase plot of the transfer function by entering f (Hz) and Phase (in degrees) points. Do not enter...
1. Find the numerical expression for the transfer function from Vi(t) to V.(t), for each circuit ...
 1. Find the numerical expression for the transfer function from Vi(t) to V.(t), for each circuit below, and sketch the magnitude and phase of the transfer function, as functions of w. For these plots, show the w axis on a log 10 scale, and show the amplitude of the transfer function on a decibel scale. 0.1uF V(t) 0.1 uF 250mH V(t) 250mH 2k2 V(t) 10k2 0.25μF Vo(t)
1. Find the numerical expression for the transfer function from Vi(t) to V.(t),...
1. Find the numerical expression for the transfer function from Vi(t) to V.(t), for each circuit below, and sketch the magnitude and phase of the transfer function, as functions of w. For these plots, show the w axis on a log 10 scale, and show the amplitude of the transfer function on a decibel scale. 0.1uF V(t) 0.1 uF 250mH V(t) 250mH 2k2 V(t) 10k2 0.25μF Vo(t)
1. Find the numerical expression for the transfer function from Vi(t) to V.(t),...
Pre-Laboratory Task 4: Derive an expression for the magnitude of the transfer function, H(Go)Vout(jo)/Wn(j, and the phase of the transfer function LH (ja) for the LCR circuit in Figure 4. Plot H(ja)l...
 Pre-Laboratory Task 4: Derive an expression for the magnitude of the transfer function, H(Go)Vout(jo)/Wn(j, and the phase of the transfer function LH (ja) for the LCR circuit in Figure 4. Plot H(ja)l and H(jo) vs. frequency (o) in the form of a Bode plot indicating the damping frequency and the value of |H(jo)| at the damping frequency. Also determine the 3dB frequency and the roll off rate for Ir(ja)1 when ω > ω3dB. Vounlius R 470Ω C 100 nF Figure...
For each of the transfer functions given below, draw the pole-zero plot and using the log- semilog paper provided on Blackboard to plot the magnitude separate from the phase as a function of frequenc...
 For each of the transfer functions given below, draw the pole-zero plot and using the log- semilog paper provided on Blackboard to plot the magnitude separate from the phase as a function of frequency. Show only the asymptotic terms that make up the transfer function and then add them to show the composite plot. You can verify your plots (to some extent) by using MATLAB to generate the plots but only as a check that the work you have done...
 21 Vi Z2 Vo Figure 1 1. Ref: Figure 1. Let Z1 L (an inductor), Z2 - R (a resistor). Vi Calculate the magnitude and phase of the transfer function H(w) Figure 1 T 2. Repeat #1 with L = 100 mH, R 1kΩ. a) Plot the frequency response in dB* on a both on a linear scale and then a log scale from ω-1 to 100,000,000 rad/sec with points every decade (1 b) 1,000 etc). 10 100 Plot the...
 Plot or sketch the magnitude vs. frequency and the phase vs.
frequency curves in a linear or log scale.
Indicate if the circuit is a low pass, high pass, band pass or
band reject filter.
We were unable to transcribe this image1 C1 R2 C2 Vout in
1 C1 R2 C2 Vout in
Plot or sketch the magnitude vs. frequency and the phase vs.
frequency curves in a linear or log scale.
Indicate if the circuit is a low pass, high pass, band pass or
band reject filter.
We were unable to transcribe this image1 C1 R2 C2 Vout in
1 C1 R2 C2 Vout in
 1. (a) sketch the Bode magnitude and phase plots of a transfer function T(W) = Vo(w) given Wo = 27x1oʻrad/s. Vi (w) (l+ges/wo2 g (6) Calculate the half-power or 3-dB Cut-off frequency of the above transfer function, and the phase LT(W) at the 3-dB cut-off frequency.
 Simulation For each filter mentioned in the following cases, first simulate the circuit using Multisim. You can get a plot of the transfer function that is called the Bode plot. From the right toolbar, select "Bode Plotter". Change initial (I) and final (F) frequencies to 1Hz and 200 KHz, respectively. Use a Voltage AC source as the input signal. You do not need to change any parameter from voltage AC source. Connect "Bode Plotter" to input and output of your...
 For the circuit shown in the figure above: Obtain an expression for H() Vo/Vi in standard form Generate spectral plots for the magnitude and phase of H (w), given that R-100Ω, L-0.1 mH, and C-1 μF Determine the cutoff frequency we and the slope of the magnitude (in dB) when wwc >1
For the circuit shown in the figure above: Obtain an expression for H() Vo/Vi in standard form Generate spectral plots for the magnitude and phase of H (w),...
For the circuit shown in the figure above: Obtain an expression for H() Vo/Vi in standard form Generate spectral plots for the magnitude and phase of H (w), given that R-100Ω, L-0.1 mH, and C-1 μF Determine the cutoff frequency we and the slope of the magnitude (in dB) when wwc >1
For the circuit shown in the figure above: Obtain an expression for H() Vo/Vi in standard form Generate spectral plots for the magnitude and phase of H (w),...
 For each filter mentioned in the following cases, first simulate the circuit using Multisim. You can get a plot of the transfer function that is called the Bode plot. From the right toolbar, select "Bode Plotter". Change initial (I) and final (F frequencies to 1Hz and 200 KHz, respectively. Use a Voltage AC source as the input signal. You do not need to change any parameter from voltage AC source Connect "Bode Plotter" to input and output of your circuit...
 1. Find the numerical expression for the transfer function from Vi(t) to V.(t), for each circuit below, and sketch the magnitude and phase of the transfer function, as functions of w. For these plots, show the w axis on a log 10 scale, and show the amplitude of the transfer function on a decibel scale. 0.1uF V(t) 0.1 uF 250mH V(t) 250mH 2k2 V(t) 10k2 0.25μF Vo(t)
1. Find the numerical expression for the transfer function from Vi(t) to V.(t),...
1. Find the numerical expression for the transfer function from Vi(t) to V.(t), for each circuit below, and sketch the magnitude and phase of the transfer function, as functions of w. For these plots, show the w axis on a log 10 scale, and show the amplitude of the transfer function on a decibel scale. 0.1uF V(t) 0.1 uF 250mH V(t) 250mH 2k2 V(t) 10k2 0.25μF Vo(t)
1. Find the numerical expression for the transfer function from Vi(t) to V.(t),...
 Pre-Laboratory Task 4: Derive an expression for the magnitude of the transfer function, H(Go)Vout(jo)/Wn(j, and the phase of the transfer function LH (ja) for the LCR circuit in Figure 4. Plot H(ja)l and H(jo) vs. frequency (o) in the form of a Bode plot indicating the damping frequency and the value of |H(jo)| at the damping frequency. Also determine the 3dB frequency and the roll off rate for Ir(ja)1 when ω > ω3dB. Vounlius R 470Ω C 100 nF Figure...
 For each of the transfer functions given below, draw the pole-zero plot and using the log- semilog paper provided on Blackboard to plot the magnitude separate from the phase as a function of frequency. Show only the asymptotic terms that make up the transfer function and then add them to show the composite plot. You can verify your plots (to some extent) by using MATLAB to generate the plots but only as a check that the work you have done...
Most questions answered within 3 hours.
-
wWhat situation is ideally suited to valuation with the dividend
growth model?
asked 2 minutes ago -
Direct Labor Variances
Bellingham Company produces a product that requires 2 standard
direct labor hours per...
asked 1 minute ago -
A munitions warehouse contains 50 bombs, of which 3 are
defective (6%). A sample of 10...
asked 18 minutes ago -
List 6 factors you should consider when designing indexes.
Please explain your answers.
asked 16 minutes ago -
Hello
I am beginner in JAVA but that does not mean i
cant do a perfect...
asked 13 minutes ago -
is
it possible for a change in one nucleotide of an organism’s DNA to
result in...
asked 46 minutes ago -
Project 5 - intro to python
Write a program in python that calculates the amount of...
asked 41 minutes ago -
Compare/Contrast the following: protein/enzyme, ligand/substrate,
channel protein/carrier protein,
exocytosis/endocytosis.
asked 52 minutes ago -
A researcher asks: Are high school students who have tried
alcohol more likely to have had...
asked 54 minutes ago -
Use a style sheet to define the following rules and implement
the given HTML code. Please...
asked 55 minutes ago -
How many grams of KBr are contained in 200 mL of a 0.310 M KBr
solution?...
asked 58 minutes ago -
The three most valuable (in terms of current exploitation)
marine physical resources in order from most...
asked 1 hour ago