

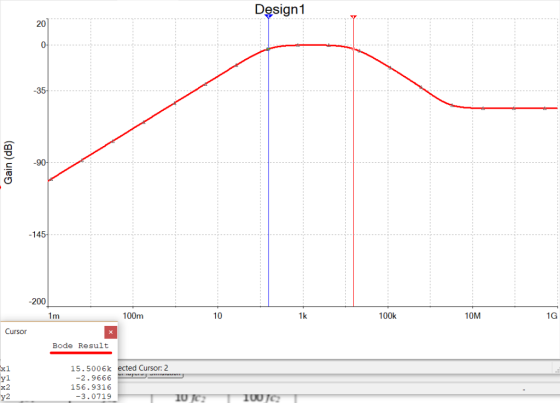
c) Active Band-pass Filter R2-10k C1-100nF R1-10K Vin Vout 10 fez 100 fc 0.01 fc fci fcz Frequency Vo/Vi 20logVo /Vi Note: The band-pass filter has two cutoff frequencies
Homework Answers

For fc1 and fc2
for 0.01 fc1 and 10fc2

for 0.1fc1 and 100fc2

| 0.01fc1 | 0.1fc1 | fc1 | fc2 | 10fc2 | 100fc2 | |
| Frequency | 1.5693 | 15.693 | 156.9316 | 15.5K | 155K | 1.55M |
| Gain | 100 | 10 | 0.707 | 0.707 | 10 | 100 |
| Gain in dB | -40 | -20 | -3 | -3 | -20 | -40 |
Add Answer to:
For each filter mentioned in the following cases, first simulate the circuit using Multisim. You can get a plot of the transfer function that is called the Bode plot. From the right toolbar, select &...
Simulation For each filter mentioned in the following cases, first simulate the circuit using Multisim. You can get a plot of the transfer function that is called the Bode plot. From the right toolba...
 Simulation For each filter mentioned in the following cases, first simulate the circuit using Multisim. You can get a plot of the transfer function that is called the Bode plot. From the right toolbar, select "Bode Plotter". Change initial (I) and final (F) frequencies to 1Hz and 200 KHz, respectively. Use a Voltage AC source as the input signal. You do not need to change any parameter from voltage AC source. Connect "Bode Plotter" to input and output of your...
3. For the active filter circuit below, complete the following: a) Find the magnitude of the...
 3. For the active filter circuit below, complete the following: a) Find the magnitude of the transfer function | H | starting from the nodal equations. b) Find the phase shift of the transfer function (W) c) Find the cutoff frequency fc in Hz d) Is this a high pass or low pass filter? e) Find the passband gain of the filter 62 k2 ANA EVA 22 nF 3.3k f) Given the following input signal: vi(t) = 1.0 sin(2nft +...
A common source amplifier circuit based on a single n-channel MOSFET is shown in Figure 4b. Assume that the transconductance gm-60 mS (equivalent to mA/ V) and drain source resistance, os,...
 A common source amplifier circuit based on a single n-channel MOSFET is shown in Figure 4b. Assume that the transconductance gm-60 mS (equivalent to mA/ V) and drain source resistance, os, is so large it may be neglected. 0) Calculate the open circuit voltage gain Av Yout/ Vis. i) The amplifier has a load of 10 k2. Determine the current gain Va. = 12 V 150k 4k3 Vout Vin 200k GND = 0 V Figure 4b a) State the name...
 Simulation For each filter mentioned in the following cases, first simulate the circuit using Multisim. You can get a plot of the transfer function that is called the Bode plot. From the right toolbar, select "Bode Plotter". Change initial (I) and final (F) frequencies to 1Hz and 200 KHz, respectively. Use a Voltage AC source as the input signal. You do not need to change any parameter from voltage AC source. Connect "Bode Plotter" to input and output of your...
 3. For the active filter circuit below, complete the following: a) Find the magnitude of the transfer function | H | starting from the nodal equations. b) Find the phase shift of the transfer function (W) c) Find the cutoff frequency fc in Hz d) Is this a high pass or low pass filter? e) Find the passband gain of the filter 62 k2 ANA EVA 22 nF 3.3k f) Given the following input signal: vi(t) = 1.0 sin(2nft +...
 A common source amplifier circuit based on a single n-channel MOSFET is shown in Figure 4b. Assume that the transconductance gm-60 mS (equivalent to mA/ V) and drain source resistance, os, is so large it may be neglected. 0) Calculate the open circuit voltage gain Av Yout/ Vis. i) The amplifier has a load of 10 k2. Determine the current gain Va. = 12 V 150k 4k3 Vout Vin 200k GND = 0 V Figure 4b a) State the name...
Most questions answered within 3 hours.
-
A cohort study is conducted to determine whether smoking is
associated with an increased risk of...
asked 2 minutes ago -
A statistics student finds herself struggling with a newspaper
article stating that only eighteen percent of...
asked 3 minutes ago -
Create the pseudo-code/flowchart for an application class named
Monogram. Its main() method inputs three variables that...
asked 3 minutes ago -
How many liters of water are required to dissolve 1.00 g of
silver chromate? Express your...
asked 5 minutes ago -
Hot: T_inlet = 80, T_out = 65
Cold: T_inlet = 10, T_out = 25
Explain in...
asked 6 minutes ago -
Two protons fly in different directions and collide. They both
have a total energy of 1.5...
asked 15 minutes ago -
What is the oxidation number of each atom in sodium phosphate,
Na3PO4?
>>> SHOW YOUR WORK...
asked 21 minutes ago -
D company purchased goods with a list price of $60000, subject
to trade discounts of 20%...
asked 24 minutes ago -
Transposable elements make up more than 40% of the human genome
and are inserted more-or-less randomly...
asked 35 minutes ago -
Can I get some samples of the following:
1) Write four sentences in first person, singular....
asked 40 minutes ago -
Described how search engines work. Be sure to describe in detail
.
asked 40 minutes ago -
The position of a particle as a function of time is given by
x=(2.0m/s)t+(−3.0m/s3)t^3. Part A...
asked 45 minutes ago