


Homework Answers
1.graph between r(cm) and (degrees)

2. conclusion drawn from the graph as distance (r) increases force decreases(here θ is a measure of force)
3.

4. force here follows inverse square law, it decreases with the increases in r(cm), r is the distance between the two bodies
5. slope represents the product of electrostatic constant and charges
6.
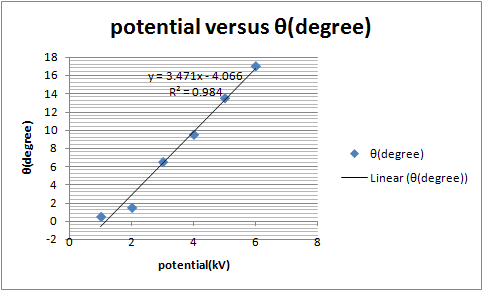
conclusion drawn from graph as the potential of source charge increases the force increases
slope here represent the ratio of charge to distance
Add Answer to:
I’m don’t understand what the slopes represent for my graphs
or what I can conclude from...
Just investigation 1 Exploring the electric field of point charges Use PHET interactive CHARGES AND FIELDS....
 Just investigation 1
Exploring the electric field of point charges Use PHET interactive CHARGES AND FIELDS. Investigation 1: Electric field due to single charges 1. Use 3 negative -1 nC charges on top of each other to make a point charge 41 = -3.0 nc on the left(ish) side of the grid, and note this point as the origin. 91 X 0 1.0 m 5.0 m 2. Use the field sensor to measure and record the electric field Eix due...
Just investigation 1
Exploring the electric field of point charges Use PHET interactive CHARGES AND FIELDS. Investigation 1: Electric field due to single charges 1. Use 3 negative -1 nC charges on top of each other to make a point charge 41 = -3.0 nc on the left(ish) side of the grid, and note this point as the origin. 91 X 0 1.0 m 5.0 m 2. Use the field sensor to measure and record the electric field Eix due...
help please, i dont know how to do it Charging A 1000uF capacitor was charged using...
 help please, i dont know how to do it
Charging A 1000uF capacitor was charged using a battery of Vo = 10V via two resistors Ry = 47kN and R2 = 27k1. The simulation was run for a total time duration of 300s. Fig 1(a) shows the charging circuit used for the simulation, Fig 1() shows the Voltage vs. time (V-t) response of the circuit charging via Rę = 47kN and Fig 1(c) shows the (V-1) response of the circuit...
help please, i dont know how to do it
Charging A 1000uF capacitor was charged using a battery of Vo = 10V via two resistors Ry = 47kN and R2 = 27k1. The simulation was run for a total time duration of 300s. Fig 1(a) shows the charging circuit used for the simulation, Fig 1() shows the Voltage vs. time (V-t) response of the circuit charging via Rę = 47kN and Fig 1(c) shows the (V-1) response of the circuit...
Exercise B1: Biological Growth Data In this exercise bacteria se students will work with "SAMPLE DATA...
 Exercise B1: Biological Growth Data In this exercise bacteria se students will work with "SAMPLE DATA #B1" given in the table below, showing population as a function of time Steps e # of cycles needed (are there 1's, 10%, 100's, 1000's in the data?) the graph with sensible and labeled axes and with clearly visible (unconnected) points (1) determin (3) draw a best-fit line "by eye" (5) inspect the best-fit line for y-intercept, No (the bacteria population at t =...
from an Atwood's machine experiment using a hanging mass to 2 The table below shows the...
 from an Atwood's machine experiment using a hanging mass to 2 The table below shows the data accrlerane a art The dfierence of the two masses was kept constant, while the total mass was Total mass M Inverse total mass 1/M (kg) 0500 0.600 0700 0 800 1.01 0.83 0.71 0.62 A Complete the third column in the table. (2 Points) B. Plot Acceleration vs. 1/M in increasing order of 1/M, on graph paper.(8 points) C Draw the best-fit straight...
Please help me out by giving me detailed answers with formulas. So I can understand fully...
Please help me out by giving me detailed answers with formulas. So I can understand fully Thank you very much A study is conducted to examine the influence of ‘screen time’ on student performance on Statistics exams. A class of 12 students is observed over a period of time, with the independent variable being the average amount of time per day each student spends on TV/internet, and the dependent variable being their subsequent Statistics exam score, in %. The data...
Above is a table of my data, I don't really understand what question seven (also pictured...
 Above is a table of my data, I don't really understand what
question seven (also pictured above) is asking for or how to make a
graph from that data that comes out even remotely linear. Any help
is greatly appreciated, and please include all the steps if
possible! Thank you so much for your time.
TRIAL 1 TRIAL 2 Skittles Skittles Round"S" Up"S" Down Parent(Daughter AtomAtoms) Skittles Skittles Cumulative Cumulative "S" DownDaughter DaughterRound (Parent (Daughteir Atoms) Atoms) Atoms Atoms 62...
Above is a table of my data, I don't really understand what
question seven (also pictured above) is asking for or how to make a
graph from that data that comes out even remotely linear. Any help
is greatly appreciated, and please include all the steps if
possible! Thank you so much for your time.
TRIAL 1 TRIAL 2 Skittles Skittles Round"S" Up"S" Down Parent(Daughter AtomAtoms) Skittles Skittles Cumulative Cumulative "S" DownDaughter DaughterRound (Parent (Daughteir Atoms) Atoms) Atoms Atoms 62...
did I do chart/part 2 correctly? also is the ice table correct? it's already done but...
 did I do chart/part 2 correctly? also is the ice table
correct? it's already done but I just want to double check. plz plz
help. I added the y=mx+b line too
2. Determine the equilibrium concentrations of each of the reactants and products in solution B-1 using the table provided below (ICE table). Fill in all blank values [Fe'l (SCN) [Fe(SCN)'1 Initial Concentration Change in Concentration 9.1E- 4 |-3.18E-5 18.8 E-4 2E-4 -3.18 E-5 2E-4 Equilibrium Concentration + 3.18 E-S...
did I do chart/part 2 correctly? also is the ice table
correct? it's already done but I just want to double check. plz plz
help. I added the y=mx+b line too
2. Determine the equilibrium concentrations of each of the reactants and products in solution B-1 using the table provided below (ICE table). Fill in all blank values [Fe'l (SCN) [Fe(SCN)'1 Initial Concentration Change in Concentration 9.1E- 4 |-3.18E-5 18.8 E-4 2E-4 -3.18 E-5 2E-4 Equilibrium Concentration + 3.18 E-S...
(I) Let's start with very simple data table 1.0 2.0 3.0 4.0 5.0 6.0 -1 ±...
 (I) Let's start with very simple data table 1.0 2.0 3.0 4.0 5.0 6.0 -1 ± 1.8 4±2.0 9+ 1.0 14 + 0.8 19 s 0.8 24 + 1.2 2% 1.8 34 ± 2.0 7.0 8.0 9.0 1. Plot a graph of y vs. X on a piece of graph paper 2. Is it a straight line? Draw the best-fit line. 3. Compute the slope and y-intercept for this line. Write the equation for y in terms of x using...
What would the units be for Table 2? e V m (Nue) (Ir) (N46) which gives...
 What would the units be for Table 2?
e V m (Nue) (Ir) (N46) which gives us: e a V (Ir) m Rearranging to the form of the equation for a straight line y = mx +b, we get e aV = (Ir) + Therefore we will plot: aV vs. (Ir)2 Remember: y vs. X Using your data from Table 1, calculate the values for Table 2. Table 2 (1r)2 αν 1 2 3 4 5 Graph 1. Open Graphical...
What would the units be for Table 2?
e V m (Nue) (Ir) (N46) which gives us: e a V (Ir) m Rearranging to the form of the equation for a straight line y = mx +b, we get e aV = (Ir) + Therefore we will plot: aV vs. (Ir)2 Remember: y vs. X Using your data from Table 1, calculate the values for Table 2. Table 2 (1r)2 αν 1 2 3 4 5 Graph 1. Open Graphical...
Use your own words to describe what is a reversible reaction and define dynamic equilibrium. What...
Use your own words to describe what is a reversible reaction and define dynamic equilibrium. What is the equilibrium Keg expression for the chemical reaction performed in this lab? (5 points) 2.Explain what is the purpose of using UV-vis spectroscopy for this particular experiment. What is the maximum wavelength in nm that the TA used to collect the absorbance value of Fe(SCN)2+ ? (5 points) 3.Use the absorbance and concentration data provided in the first part of the TA video...
 Just investigation 1
Exploring the electric field of point charges Use PHET interactive CHARGES AND FIELDS. Investigation 1: Electric field due to single charges 1. Use 3 negative -1 nC charges on top of each other to make a point charge 41 = -3.0 nc on the left(ish) side of the grid, and note this point as the origin. 91 X 0 1.0 m 5.0 m 2. Use the field sensor to measure and record the electric field Eix due...
Just investigation 1
Exploring the electric field of point charges Use PHET interactive CHARGES AND FIELDS. Investigation 1: Electric field due to single charges 1. Use 3 negative -1 nC charges on top of each other to make a point charge 41 = -3.0 nc on the left(ish) side of the grid, and note this point as the origin. 91 X 0 1.0 m 5.0 m 2. Use the field sensor to measure and record the electric field Eix due...
 help please, i dont know how to do it
Charging A 1000uF capacitor was charged using a battery of Vo = 10V via two resistors Ry = 47kN and R2 = 27k1. The simulation was run for a total time duration of 300s. Fig 1(a) shows the charging circuit used for the simulation, Fig 1() shows the Voltage vs. time (V-t) response of the circuit charging via Rę = 47kN and Fig 1(c) shows the (V-1) response of the circuit...
help please, i dont know how to do it
Charging A 1000uF capacitor was charged using a battery of Vo = 10V via two resistors Ry = 47kN and R2 = 27k1. The simulation was run for a total time duration of 300s. Fig 1(a) shows the charging circuit used for the simulation, Fig 1() shows the Voltage vs. time (V-t) response of the circuit charging via Rę = 47kN and Fig 1(c) shows the (V-1) response of the circuit...
 Exercise B1: Biological Growth Data In this exercise bacteria se students will work with "SAMPLE DATA #B1" given in the table below, showing population as a function of time Steps e # of cycles needed (are there 1's, 10%, 100's, 1000's in the data?) the graph with sensible and labeled axes and with clearly visible (unconnected) points (1) determin (3) draw a best-fit line "by eye" (5) inspect the best-fit line for y-intercept, No (the bacteria population at t =...
 from an Atwood's machine experiment using a hanging mass to 2 The table below shows the data accrlerane a art The dfierence of the two masses was kept constant, while the total mass was Total mass M Inverse total mass 1/M (kg) 0500 0.600 0700 0 800 1.01 0.83 0.71 0.62 A Complete the third column in the table. (2 Points) B. Plot Acceleration vs. 1/M in increasing order of 1/M, on graph paper.(8 points) C Draw the best-fit straight...
 Above is a table of my data, I don't really understand what
question seven (also pictured above) is asking for or how to make a
graph from that data that comes out even remotely linear. Any help
is greatly appreciated, and please include all the steps if
possible! Thank you so much for your time.
TRIAL 1 TRIAL 2 Skittles Skittles Round"S" Up"S" Down Parent(Daughter AtomAtoms) Skittles Skittles Cumulative Cumulative "S" DownDaughter DaughterRound (Parent (Daughteir Atoms) Atoms) Atoms Atoms 62...
Above is a table of my data, I don't really understand what
question seven (also pictured above) is asking for or how to make a
graph from that data that comes out even remotely linear. Any help
is greatly appreciated, and please include all the steps if
possible! Thank you so much for your time.
TRIAL 1 TRIAL 2 Skittles Skittles Round"S" Up"S" Down Parent(Daughter AtomAtoms) Skittles Skittles Cumulative Cumulative "S" DownDaughter DaughterRound (Parent (Daughteir Atoms) Atoms) Atoms Atoms 62...
 did I do chart/part 2 correctly? also is the ice table
correct? it's already done but I just want to double check. plz plz
help. I added the y=mx+b line too
2. Determine the equilibrium concentrations of each of the reactants and products in solution B-1 using the table provided below (ICE table). Fill in all blank values [Fe'l (SCN) [Fe(SCN)'1 Initial Concentration Change in Concentration 9.1E- 4 |-3.18E-5 18.8 E-4 2E-4 -3.18 E-5 2E-4 Equilibrium Concentration + 3.18 E-S...
did I do chart/part 2 correctly? also is the ice table
correct? it's already done but I just want to double check. plz plz
help. I added the y=mx+b line too
2. Determine the equilibrium concentrations of each of the reactants and products in solution B-1 using the table provided below (ICE table). Fill in all blank values [Fe'l (SCN) [Fe(SCN)'1 Initial Concentration Change in Concentration 9.1E- 4 |-3.18E-5 18.8 E-4 2E-4 -3.18 E-5 2E-4 Equilibrium Concentration + 3.18 E-S...
 (I) Let's start with very simple data table 1.0 2.0 3.0 4.0 5.0 6.0 -1 ± 1.8 4±2.0 9+ 1.0 14 + 0.8 19 s 0.8 24 + 1.2 2% 1.8 34 ± 2.0 7.0 8.0 9.0 1. Plot a graph of y vs. X on a piece of graph paper 2. Is it a straight line? Draw the best-fit line. 3. Compute the slope and y-intercept for this line. Write the equation for y in terms of x using...
 What would the units be for Table 2?
e V m (Nue) (Ir) (N46) which gives us: e a V (Ir) m Rearranging to the form of the equation for a straight line y = mx +b, we get e aV = (Ir) + Therefore we will plot: aV vs. (Ir)2 Remember: y vs. X Using your data from Table 1, calculate the values for Table 2. Table 2 (1r)2 αν 1 2 3 4 5 Graph 1. Open Graphical...
What would the units be for Table 2?
e V m (Nue) (Ir) (N46) which gives us: e a V (Ir) m Rearranging to the form of the equation for a straight line y = mx +b, we get e aV = (Ir) + Therefore we will plot: aV vs. (Ir)2 Remember: y vs. X Using your data from Table 1, calculate the values for Table 2. Table 2 (1r)2 αν 1 2 3 4 5 Graph 1. Open Graphical...
Most questions answered within 3 hours.
-
MATLAB HW 11 problem using Switch Case and Input commands
Write a script file that calculates...
asked 15 minutes ago -
A college student is employed as a door-to-door newspaper
salesman. Historical data suggests that the student...
asked 30 minutes ago -
Considering gravitational time dilation, calculate the time that
passes in Earth’s surface while 1 hour passes...
asked 54 minutes ago -
Minitab Problem: Take the Lake Hume June rainfall data and find
use the processes outlined in...
asked 1 hour ago -
X Company is trying to decide whether to continue using old
equipment to make Product A...
asked 1 hour ago -
IN PYTHON ONLY !! Program 2: Re-work
program #5 (WeeklyHours) from the previous assignment such that...
asked 2 hours ago -
The average length of time between arrivals at a turnpike
toll-booth is 26 seconds. What is...
asked 4 hours ago -
(a) A piston at 6.1 atm contains a gas that occupies a volume of
3.5 L....
asked 5 hours ago -
Please answer true or false. Words
cannot be changed or added in to make it true...
asked 5 hours ago -
An empty test tube weighs 15.923 grams. Then,
MgCl2•6H2O is added into the test tube. After...
asked 5 hours ago -
Assume memory access is 10 units of time and disk access is
10000 units of time....
asked 5 hours ago -
1. Are all good samples random?
2. Magazines often report surveys giving statistics such as “63%...
asked 5 hours ago