a. a 95% confidence interval for the population mean Age; b. a 99% confidence interval for...
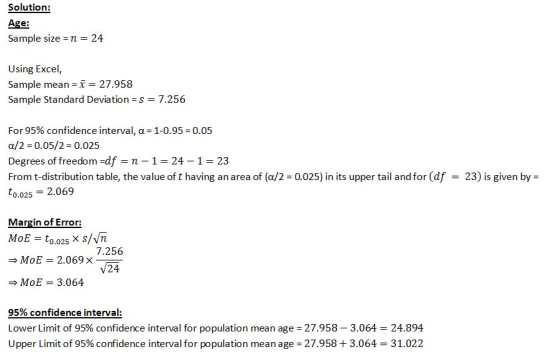
a. a 95% confidence interval for the population mean Age;
b. a 99% confidence interval for the population mean Income;
c. a 90% confidence interval for the population proportion of
Males.
use ms excel file
| Product | Age | Gender | Education | Marital Status | Usage | Fitness | Income | Miles |
| TM195 | 18 | Male | 14 | Single | 3 | 4 | 29562 | 112 |
| TM195 | 23 | Male | 16 | Partnered | 4 | 3 | 39795 | 94 |
| TM195 | 24 | Female | 16 | Single | 4 | 3 | 46617 | 75 |
| TM195 | 26 | Male | 16 | Partnered | 2 | 2 | 53439 | 47 |
| TM195 | 29 | Female | 14 | Partnered | 2 | 2 | 46617 | 38 |
| TM195 | 34 | Male | 16 | Single | 4 | 5 | 51165 | 169 |
| TM195 | 38 | Male | 16 | Partnered | 3 | 3 | 56850 | 75 |
| TM498 | 20 | Female | 14 | Partnered | 3 | 3 | 34110 | 106 |
| TM498 | 20 | Male | 14 | Single | 3 | 3 | 38658 | 95 |
| TM498 | 23 | Male | 16 | Partnered | 4 | 3 | 45480 | 127 |
| TM498 | 25 | Female | 14 | Partnered | 2 | 3 | 45480 | 85 |
| TM498 | 25 | Male | 14 | Partnered | 4 | 3 | 45480 | 170 |
| TM498 | 25 | Male | 14 | Partnered | 3 | 4 | 43206 | 106 |
| TM498 | 25 | Male | 16 | Partnered | 2 | 3 | 50028 | 53 |
| TM498 | 31 | Female | 16 | Partnered | 2 | 3 | 51165 | 64 |
| TM498 | 34 | Male | 16 | Partnered | 3 | 4 | 59124 | 85 |
| TM498 | 34 | Male | 15 | Single | 3 | 3 | 67083 | 85 |
| TM498 | 40 | Female | 16 | Partnered | 3 | 3 | 61398 | 85 |
| TM798 | 22 | Male | 16 | Single | 3 | 5 | 54781 | 120 |
| TM798 | 23 | Male | 16 | Single | 4 | 5 | 58516 | 140 |
| TM798 | 25 | Female | 18 | Partnered | 5 | 5 | 61006 | 200 |
| TM798 | 25 | Male | 18 | Partnered | 6 | 4 | 70966 | 180 |
| TM798 | 34 | Male | 16 | Single | 5 | 5 | 92131 | 150 |
| TM798 | 48 | Male | 18 | Partnered | 4 | 5 | 95508 | 180 |
Homework Answers


Add Answer to:
a. a 95% confidence interval for the population mean Age;
b. a 99% confidence interval for...
Based on the class sample, you will create a 95% confidence interval for the mean age...
 Based on the class sample, you will create a 95% confidence interval for the mean age and the proportion of males in the population of all online college students. Using the same sheet as part 2, answer the following in the "week 5"tab: . For the average age, form a 95% confidence interval: o What distribution should be used? What is the critical value? o What is the error bound? o What is the lower bound? o What is the...
And construct a 95% confidence interval for the population mean for sample B 8.2.13-1 95% confidence...
 And construct a 95% confidence interval for the population mean
for sample B
8.2.13-1 95% confidence interval for the population mean for each of the samples below plain why these Assuming that the population is normally distributed, construct a two samples produce differen t confidence intervals even though they have the same mean and range Full dataset SampleA: 1 1 4 4 5 5 8 8 Sample B: 1 2 3 45 6 7 8 Construct a 95% confidence interval...
And construct a 95% confidence interval for the population mean
for sample B
8.2.13-1 95% confidence interval for the population mean for each of the samples below plain why these Assuming that the population is normally distributed, construct a two samples produce differen t confidence intervals even though they have the same mean and range Full dataset SampleA: 1 1 4 4 5 5 8 8 Sample B: 1 2 3 45 6 7 8 Construct a 95% confidence interval...
m. If the 95% confidence interval limits for the population mean are 70 and 80, which...
 m. If the 95% confidence interval limits for the population mean are 70 and 80, which of the following could be the 90% confidence interval limits? Please justify your answer. A. 72 and 78 B.65 and 75 c. 65 and 85 D.72 and 85
10. Properties of a confidence interval Suppose the mean of a population is 22. A researcher...
 10. Properties of a confidence interval Suppose the mean of a population is 22. A researcher (who does not know that p Then she constructs a 95% confidence interval of the population mean. 22) selects a random sample of size n from this population. The true population mean and the researcher's 95% confidence interval of the population mean are shown in the following graph. Use the graph to answer the questions that follow Sample Mean 95% Confidence interval of the...
А - B с D E F G H J K L Points 95% Confidence Interval...
 А - B с D E F G H J K L Points 95% Confidence Interval for Average Age of Online College Students: 1 Age 2 3 4 5 Sample Mean: Sample St. Dev: Sample Size: 31.29 10.18 21.9 mil 1 6 7 2 Distribution: T-Distribution 2 Critical Value: *2 decimals 2 1 1 Margin of Error: Lower Bound: Upper Bound: *2 decimals Calculation: *2 decimals Calculation: *2 decimals Calculation: 2 Interpret 95% Confidence interval for Proportion of Male Online...
Create a confidence interval for a population mean and interpret it. Use either 90 95 or...
Create a confidence interval for a population mean and interpret it. Use either 90 95 or 99 percent confidence interval. Do this for each quantitative question. Remember to interpret the confidence intervals. CREATE CONFIDENCE INTERVAL FOR PRICE AND SIZE record Agent Price Size Bedrooms Baths Pool (yes is 1) Garage (Yes is 1) Days Township Mortgage type Years FICO Default (Yes is 1) 1 Marty 206424 1820 2 1.5 1 1 33 2 Fixed 2 824 0 2 Rose 346150...
Assuming that the population is normally distributed, construct a 95% confidence interval for the population mean,...
Assuming that the population is normally distributed, construct a 95% confidence interval for the population mean, based on the following sample size of .n=7. 1, 2, 3, 4, 5, 6, and 15 <-----this is the data In the given data, replace the value 15 with 7 and recalculate the confidence interval. Using these results, describe the effect of an outlier (that is, an extreme value) on the confidence interval, in general. Find a 95% confidence interval for the population mean,...
Assuming that the population is normally distributed, construct a 99% confidence interval for the population mean,...
 Assuming that the population is normally distributed, construct a 99% confidence interval for the population mean, based on e ollowing sample sizeof 1, 2, 3, 4, 5, 6, 7, and 25 In the given data, replace the value 25 with 8 and recalculate the confidence interval. Using these results, describe the effect of an outlier (that is, an extreme value) on the confidence interval, in general. Find a 99% confidence interval for the population mean, using the formula or technology....
19. The 99% confidence interval is _________ than 95% confidence interval in a same problem. a....
19. The 99% confidence interval is _________ than 95% confidence interval in a same problem. a. smaller b. larger 20. Suppose 95% confidence interval of the population mean is (4.5, 9.7). (20.a) The population mean must be in the range (4.5, 9.7). a. True b. False (20.b) What is the chance of error if you say that the population mean is somewhere in the range (4.5, 9.7) a. 0.95 b. 0.05 c. 0 d. 0.5 (20.c) How sure is it...
Construct a confidence interval for the population mean using a t-distribution: c = 95% m =...
Construct a confidence interval for the population mean using a t-distribution: c = 95% m = 18 s = 5 n = 25. Choose from the intervals listed below.
 Based on the class sample, you will create a 95% confidence interval for the mean age and the proportion of males in the population of all online college students. Using the same sheet as part 2, answer the following in the "week 5"tab: . For the average age, form a 95% confidence interval: o What distribution should be used? What is the critical value? o What is the error bound? o What is the lower bound? o What is the...
 And construct a 95% confidence interval for the population mean
for sample B
8.2.13-1 95% confidence interval for the population mean for each of the samples below plain why these Assuming that the population is normally distributed, construct a two samples produce differen t confidence intervals even though they have the same mean and range Full dataset SampleA: 1 1 4 4 5 5 8 8 Sample B: 1 2 3 45 6 7 8 Construct a 95% confidence interval...
And construct a 95% confidence interval for the population mean
for sample B
8.2.13-1 95% confidence interval for the population mean for each of the samples below plain why these Assuming that the population is normally distributed, construct a two samples produce differen t confidence intervals even though they have the same mean and range Full dataset SampleA: 1 1 4 4 5 5 8 8 Sample B: 1 2 3 45 6 7 8 Construct a 95% confidence interval...
 m. If the 95% confidence interval limits for the population mean are 70 and 80, which of the following could be the 90% confidence interval limits? Please justify your answer. A. 72 and 78 B.65 and 75 c. 65 and 85 D.72 and 85
 10. Properties of a confidence interval Suppose the mean of a population is 22. A researcher (who does not know that p Then she constructs a 95% confidence interval of the population mean. 22) selects a random sample of size n from this population. The true population mean and the researcher's 95% confidence interval of the population mean are shown in the following graph. Use the graph to answer the questions that follow Sample Mean 95% Confidence interval of the...
 А - B с D E F G H J K L Points 95% Confidence Interval for Average Age of Online College Students: 1 Age 2 3 4 5 Sample Mean: Sample St. Dev: Sample Size: 31.29 10.18 21.9 mil 1 6 7 2 Distribution: T-Distribution 2 Critical Value: *2 decimals 2 1 1 Margin of Error: Lower Bound: Upper Bound: *2 decimals Calculation: *2 decimals Calculation: *2 decimals Calculation: 2 Interpret 95% Confidence interval for Proportion of Male Online...
 Assuming that the population is normally distributed, construct a 99% confidence interval for the population mean, based on e ollowing sample sizeof 1, 2, 3, 4, 5, 6, 7, and 25 In the given data, replace the value 25 with 8 and recalculate the confidence interval. Using these results, describe the effect of an outlier (that is, an extreme value) on the confidence interval, in general. Find a 99% confidence interval for the population mean, using the formula or technology....
Most questions answered within 3 hours.
-
what was Uniroyal's motivation in lobbying the government to
create a tire-rating standard? Select one: a....
asked 2 minutes ago -
Pat's Place has sales of $613,700 and cost of goods sold of
$338,514. At the beginning...
asked 4 minutes ago -
Your firm had net sales of $80,000 this past year and
receivables of $20,000; and the...
asked 7 minutes ago -
which of the following combinations of quantum numbers(
n,l,ml,ms) is not allowed
9,8,-4,1/2
4,-2,-1,1/2
8,2,21/2
6,5,-5,1/2
asked 9 minutes ago -
*There are two different answers posted. Other students
were asked the same question. Which response is...
asked 9 minutes ago -
If a vulnerability exists in 480 servers out of the first 900
tested, what is the...
asked 11 minutes ago -
A lab was done for the bromination of E-stilbene to create
1,2-dibromo-1,2-diphenylethane. In this lab, E-stilbene...
asked 10 minutes ago -
A plane takes off and climbs to 3 000 m in five minutes at an
angle...
asked 26 minutes ago -
A share of common stock just paid a dividend of $1.00 If the
expected long-run growth...
asked 25 minutes ago -
The following data shows the weekly amount spent on pet hair
care products for a sample...
asked 25 minutes ago -
Tim Smunt has been asked to evaluate two machines. After some
investigation, he determines that they...
asked 28 minutes ago -
Paclitaxel, C47H51NO14, is an anticancer compound that is
difficult to make in the lab. One reported...
asked 30 minutes ago