

Homework Answers
Several factors shape the treasury yield curve—monetary policy, inflation expectations, investor preferences, and macroeconomic influences from around the world.
The treasury yield curve describes how treasury interest rates differ across the maturity of treasury assets. The yield curve is determined to a large extent by monetary policy, investors’ expectations of future economic activity and inflation, and investor preferences. While shifts at the short end of the yield curve reflect immediate monetary policy, changes at the long end of the curve reflect the influence of various economic factors that are not limited to the United States alone.
How does a treasury’s maturity help determine its yield?
The shortest-term treasury bills1 are mainly determined by monetary policy. The Federal Open Market Committee (FOMC) sets a target for the federal funds rate (the overnight rate at which banks trade funds parked with the Federal Reserve). The federal funds rate is then the main point of reference for various short-term interest rates including the rate on short-term treasury bills.
Long-term rates differ from short-term rates because of three main reasons:
1. Inflation expectations: Investors’ expectations of future inflation are worked into the yield on long-term treasuries. The relationship between current short-term rates, future expected short-term rates (based on investors’ inflation expectations), and long-term rates is explained by the expectation theory of the term structure. The theory states that the shape of the treasury yield curve is determined by investors’ expectations of future short-term interest rates. Furthermore, the expectation hypothesis implies that holding a one-year bond and rolling the investment over into a new one-year bond each year for 10 years would result in the same wealth as investing in a 10-year bond. In other words, short-term bonds that add up to the same maturity as a single long-term bond are collectively a perfect substitute for the long-term bond. In mathematical form the return on a long-term bond can be expressed as:
 This formula shows that the
return on a long-term bond is the geometric mean of the expected
return on several short-term bonds that add up to the same
maturity.
This formula shows that the
return on a long-term bond is the geometric mean of the expected
return on several short-term bonds that add up to the same
maturity.
2. Risk premiums (because lending money for a longer period of time is usually riskier than lending money for a shorter period of time): The expectation theory fails to explain the persistence of an upward sloping yield curve in the long run because in that period (consisting of several business cycles), short-term interest rates are just as likely to rise as they are to fall. The more-often-than-not upward slope of the yield curve is due to an additional component of yield on long-term bonds—a risk premium. The risk premium serves as a hedge against possible loss of capital over time and consists of:
- Real risk premium
- Inflation risk premium
3. Investor preferences: Investors in long-term treasuries usually develop a preference for treasuries of a certain period to maturity. In other words, investors have a preferred investment range (preferred period to maturity) and will be willing to invest beyond their preferred range only if they are offered a term premium that accounts for risk and serves as an incentive.
How has the treasury yield curve moved and what’s shaping the curve today?
Yields across all maturity periods are currently near historic lows—even after the Federal Reserve hiked the target range for the federal funds rate by 0.25 percent in December 2015. Figure 1 shows the treasury yield curve as of January 27, 2016.

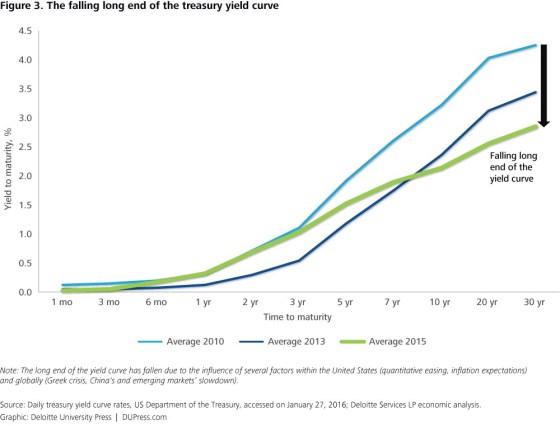
After the Federal Reserve hiked the funds rate, the short end of the curve began to rise as the yield on short-term treasury bills reflected tighter monetary policy (figure 2). The long end of the yield curve did not rise since changes to the federal funds rate do not have a direct impact on long-term yields. As mentioned earlier, long-term yields are influenced by inflation expectations, risk premium, and investor preferences. In fact, the long end of the yield curve has fallen substantially in the past five years (see figure 3).

While immediate monetary policy is responsible for the liftoff at the short end of the curve, several other factors have resulted in the fall at the long end of the treasury yield curve, including:
- Expectations of low inflation
- The Greek crisis, and the slowdown in China and in emerging markets, which have resulted in the flight of capital to safe havens such as long-term US treasuries
- The Fed’s quantitative easing program, which resulted in the removal of more than $1 trillion long-term treasuries from the market between 2010 and 2014
Future changes in the slope of the treasury yield curve are expected to be determined by the course of monetary policy, changes in inflation expectations, and further developments in the global economy.
Add Answer to:
BEGINNING OF TERM END OF TERM a. Stock market index information: S&P 500 (stock) index level...
14. If an investor buys a $50,000, 90-day T-bill for $49,2 annualized return on a simple...
 14. If an investor buys a $50,000, 90-day T-bill for $49,2 annualized return on a simple (arithmetic) basis is: n l( 50 and holds i ill maturity,the 15. A newly issued T-bill with a $10,000 par value that sells for $9,850 maturity has a discount return of c. at a discount from par value d, only through a financial intermediary 16. Both T-bills and paper are a, with a stated coupon rate b at a premium above par value 17....
the low Managing in Financial Markets Money Market Portfolio Dilemma As the treasurer of a corporation,...
 the low Managing in Financial Markets Money Market Portfolio Dilemma As the treasurer of a corporation, one of your jobs is to maintain investments in liquid securities such as Treasury securities and commercial paper. Your goal i to earn as high a return as possible but without takin much of a risk a. The yield curve is currently upward sloping, such that 10-year Treasury bonds have an annualized yield 3 percentage points above the annualized yield of three-month T-bills. Should...
Match the following terms to the explanation provided. Hedge Fund Credit Union Commercial Bank Financial services...
Match the following terms to the explanation provided. Hedge Fund Credit Union Commercial Bank Financial services corporation Common Stock US Treasury Bills Bankers' Acceptances Preferred Stock Certificate of Deposit Commercial Paper Bond Mutual Fund A Ownership of a large corporation by another company investor B Investment with a set maturity date offered by commercial bank C Short term debt negotiated among commercial banks D Pooling of sophisticated investor funds to invest contrary to markets E Financial services company providing loans...
Suppose the value of the S&P 500 stock index is currently 2,000. a. If the 1-year...
 Suppose the value of the S&P 500 stock index is currently 2,000. a. If the 1-year T-bill rate is 3% and the expected dividend yield on the S&P 500 is 1%, what should the 1-year maturity futures price be? Futures price b. What if the T-bill rate is less than the dividend yield, for example, 1%? The T-bill rate is less than the dividend yield, then the futures price should be (Click to select)
Suppose the value of the S&P 500 stock index is currently 900. a. If the 1-year...
 Suppose the value of the S&P 500 stock index is currently 900. a. If the 1-year T-bill rate is 5% and the expected dividend yield on the S&P 500 is 3%, what should the 1-year maturity futures price be? Futures price b. What if the T-bill rate is less than the dividend yield, for example, 1%? The T-bill rate is less than the dividend yield, then the futures price should be (Click to select))
9. What is the duration of the floating rate mortgages? a. 0.25 years b. 10 years c. 2 years d. 0...
 9. What is the duration of the floating rate mortgages?
a. 0.25 years
b. 10 years
c. 2 years
d. 0.5 years
e. There is not enough information to answer the
question.
the right answer is A please show the work
Bank of Baruch ion Assets: 91 day US Treasury bill 2 year commercial loans $150m 75m Liabilities 1 year Certificates of Deposit 5 year Bonds $825n 70n Fixed rate, 9% pa. annually 10 year corporate loans-floating rate Overnight Fed...
9. What is the duration of the floating rate mortgages?
a. 0.25 years
b. 10 years
c. 2 years
d. 0.5 years
e. There is not enough information to answer the
question.
the right answer is A please show the work
Bank of Baruch ion Assets: 91 day US Treasury bill 2 year commercial loans $150m 75m Liabilities 1 year Certificates of Deposit 5 year Bonds $825n 70n Fixed rate, 9% pa. annually 10 year corporate loans-floating rate Overnight Fed...
19. The Ple ratio for the S&P 500 (an index that contains 500 stocks with large...
 19. The Ple ratio for the S&P 500 (an index that contains 500 stocks with large market capitalizations) is 18. The yield to maturity on 30-year fixed-rate U.S. government Treasury bonds is 3.01%. The 30-year TIPS yield is 0.99%. What is the expected long-term return on the stock market? derate list gocem ent Proceuly bonds is The Soligeir Tops yield is A. 2.02% B. 7.58% C. 20.02% D. 5.03% E. 4.57% 20. The Ple ratio for the S&P 500 (an...
Suppose the value of the S&P 500 stock index is currently 1,000. 1-a. If the 1-year...
Suppose the value of the S&P 500 stock index is currently 1,000. 1-a. If the 1-year T-bill rate is 7% and the expected dividend yield on the S&P 500 is 6%, what should the 1-year maturity futures price be? Futures price $ 1-b. What if the T-bill rate is less than the dividend yield, for example, 1%? If the t-bill rate is less than the dividend yield, then the futures price should be: a.)less than the spot price b.) more...
*Assuming the value of the S&P 500 stock index is currently priced at 2980, and the...
 *Assuming the value of the S&P 500 stock index is currently priced at 2980, and the 1-year T-bill rate is yielding 2%, and the expected dividend yield on the S&P 500 is 2.5%, what should the 6-Months Futures Contract be priced at?
Date of lookup data: March 1st, 2019 Money Market Rates, etc. U.S. Treasurys [†,1] ...
Date of lookup data: March 1st, 2019 Money Market Rates, etc. U.S. Treasurys [†,1] Security Yield T-Bill, Note, Bond Yield 1-month Euro LIBOR -0.41% 1-month T-Bill 2.44% 1-month U.S T-Bill 2.39% 2-month T-Bill 2.46% 1-month LIBOR 2.48% 3-month T-Bill 2.44% Federal Funds 2.40% 6-month T-Bill 2.52% Federal Reserve Discount Rate 1.00% 1-Year T-Bill 2.55% Negotiable CDs 2.69% 2-Year T-Note 2.55% U.S Commercial Paper 2.40% 3-Year T-Note 2.54% Overnight Repos 2.40% 5-Year T-Note 2.56% Banker's Acceptance 6.62% 7-Year T-Note 2.67% Eurodollar...
 14. If an investor buys a $50,000, 90-day T-bill for $49,2 annualized return on a simple (arithmetic) basis is: n l( 50 and holds i ill maturity,the 15. A newly issued T-bill with a $10,000 par value that sells for $9,850 maturity has a discount return of c. at a discount from par value d, only through a financial intermediary 16. Both T-bills and paper are a, with a stated coupon rate b at a premium above par value 17....
 the low Managing in Financial Markets Money Market Portfolio Dilemma As the treasurer of a corporation, one of your jobs is to maintain investments in liquid securities such as Treasury securities and commercial paper. Your goal i to earn as high a return as possible but without takin much of a risk a. The yield curve is currently upward sloping, such that 10-year Treasury bonds have an annualized yield 3 percentage points above the annualized yield of three-month T-bills. Should...
 Suppose the value of the S&P 500 stock index is currently 2,000. a. If the 1-year T-bill rate is 3% and the expected dividend yield on the S&P 500 is 1%, what should the 1-year maturity futures price be? Futures price b. What if the T-bill rate is less than the dividend yield, for example, 1%? The T-bill rate is less than the dividend yield, then the futures price should be (Click to select)
 Suppose the value of the S&P 500 stock index is currently 900. a. If the 1-year T-bill rate is 5% and the expected dividend yield on the S&P 500 is 3%, what should the 1-year maturity futures price be? Futures price b. What if the T-bill rate is less than the dividend yield, for example, 1%? The T-bill rate is less than the dividend yield, then the futures price should be (Click to select))
 9. What is the duration of the floating rate mortgages?
a. 0.25 years
b. 10 years
c. 2 years
d. 0.5 years
e. There is not enough information to answer the
question.
the right answer is A please show the work
Bank of Baruch ion Assets: 91 day US Treasury bill 2 year commercial loans $150m 75m Liabilities 1 year Certificates of Deposit 5 year Bonds $825n 70n Fixed rate, 9% pa. annually 10 year corporate loans-floating rate Overnight Fed...
9. What is the duration of the floating rate mortgages?
a. 0.25 years
b. 10 years
c. 2 years
d. 0.5 years
e. There is not enough information to answer the
question.
the right answer is A please show the work
Bank of Baruch ion Assets: 91 day US Treasury bill 2 year commercial loans $150m 75m Liabilities 1 year Certificates of Deposit 5 year Bonds $825n 70n Fixed rate, 9% pa. annually 10 year corporate loans-floating rate Overnight Fed...
 19. The Ple ratio for the S&P 500 (an index that contains 500 stocks with large market capitalizations) is 18. The yield to maturity on 30-year fixed-rate U.S. government Treasury bonds is 3.01%. The 30-year TIPS yield is 0.99%. What is the expected long-term return on the stock market? derate list gocem ent Proceuly bonds is The Soligeir Tops yield is A. 2.02% B. 7.58% C. 20.02% D. 5.03% E. 4.57% 20. The Ple ratio for the S&P 500 (an...
 *Assuming the value of the S&P 500 stock index is currently priced at 2980, and the 1-year T-bill rate is yielding 2%, and the expected dividend yield on the S&P 500 is 2.5%, what should the 6-Months Futures Contract be priced at?
Most questions answered within 3 hours.
-
A combustion reaction is describes as a carbon source reacting
with oxygen and producing carbon dioxide...
asked 5 minutes ago -
Buckminsterfullerence is a recently allotrope of carbon in which
carbon atoms form molecules of formula C_60,...
asked 7 minutes ago -
Lower Equitorial and Upper Equitorial are the same except Lower
Equitorial has a larger capital stock....
asked 12 minutes ago -
how do you think that pH of a jar where you have added a certain
amount...
asked 22 minutes ago -
If the Federal Reserve increases the reserve requirement, what
will happen to the Money Supply in...
asked 17 minutes ago -
Suppose that market demand for a good is given by Q = 9 - 0.3 P...
asked 23 minutes ago -
two thin lenses are separated by a distance x. The first lens
has a focal length...
asked 24 minutes ago -
The computer that controls a bank's automatic teller machine
crashes a mean of 0.6 times per...
asked 28 minutes ago -
`1) How is -9 (base 10) represented in 8-bit two's complement
notation?
a) 00001001
b)11110111
c)11110110...
asked 38 minutes ago -
A 10.000 g sample of water contains 11.19% H by mass. what
should be the %H...
asked 55 minutes ago -
Consider an investment game among 2 players. Each player can
either invest,
i, or not invest,-i....
asked 53 minutes ago -
The time taken to complete a particular task is normally
distributed with a standard deviation of...
asked 1 hour ago