Question
We want to know whether boys or girls get into trouble more often in school. Below...
We want to know whether boys or girls get into trouble more often in school. Below is the table documenting the percentage of boys and girls who got int
| Gender | Got in Trouble | No Trouble | Total |
| Boys | 43 | 71 | 117 |
| Girls | 37 | 83 | 120 |
| Total | 83 | 154 | 237 |
- Examine statistically whether boys got in trouble in school more often. Can you create a StatCrunch crosstabulation table result for this data?
- Perform the chi-square analysis. Make sure to state the five steps of the hypothesis test.
Homework Answers
Answer #1

Solution:- ep Let ter School got Arouble Schao or tuble OH en est oant ue. in deperder . Ho AHYibutes are step 2 Gender Got Tn touble Total o tcbl e Boys 4-3 1 120 83 Gls 2 7 total 37 83 step-3 Retotal) Palome (total) fxpected Values Crtard otal Gende Gokin trouble Not touble Boys 38.94 5025 41.025 Gixls Lb.8Ł ep 4(-o Not ouble Got introuble Gender 0.2160 o.4-15& 0 2450 Girls
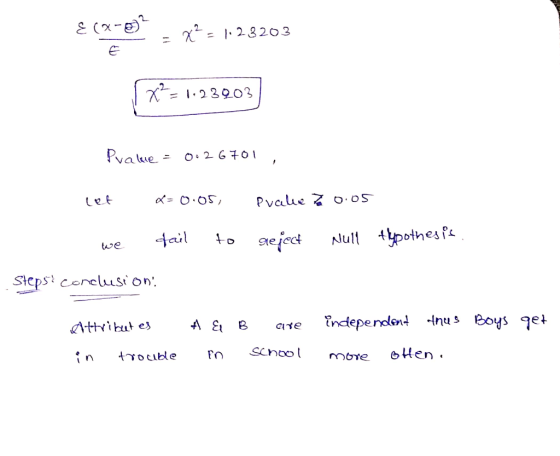
28203 -- = 2 39 O3 Pvakue O.OS, le Nul 4ypothes areject ail twe Steps conclusion Boys et inctependlent inus A E B Attribut es School 6Нen. tyocible more
Know the answer?
Add Answer to:
We want to know whether boys or girls get into trouble more
often in school. Below...
Not the answer you're looking for?
Ask your own homework help question.
Our experts will answer your question WITHIN MINUTES for Free.
Similar Homework Help Questions
1. We reject the null hypothesis only when: a. our sample mean is larger than the population mean. b. the p value asso...
1. We reject the null hypothesis only when: a. our sample mean is larger than the population mean. b. the p value associated with our test statistic is greater than the significance level of the test we have chosen. c. our sample mean is smaller than the population mean. d. the p value associated with our test statistic is smaller than the significance level of the test we have chosen. 2. In a study of simulated juror decision making, researchers...
ADVERTISEMENT
Need Online Homework Help?
Ask
a QuestionGet Answers For Free
Most questions answered within 3 hours.
Most questions answered within 3 hours.
ADVERTISEMENT
ADVERTISEMENT
Active Questions
-
A 63kg client has been told to cycle at 60% of her 7 MET
capacity. What...
asked 8 seconds ago -
A laser beam is incident on two slits with a separation of 0.215
mm, and a...
asked 5 minutes ago -
if(qtySold > QUOTA)
bonusPay = 50;
totalPay = regPay + bonusPay;
System.out.println("Your totalPay amount is "...
asked 6 minutes ago -
A sample of 100 units showed a sample mean 12 oz with a standard
deviation 3...
asked 7 minutes ago -
Investors who find out what shares Warren Buffett, a famous
investor, is buying or selling to...
asked 21 minutes ago -
b) Compute the mean for all 5 Upper C 2 equals 10 samples with
size nequals2....
asked 28 minutes ago -
Giving a test to a group of students, the grades and gender are
summarized below A...
asked 31 minutes ago -
The ["VTP", "SNMP", "SMTP", "IPX"]
protocol is used by a collection of
switches...
asked 29 minutes ago -
MnO−4 reacts with
Fe2+ in acid solution to produce
Fe3+ and Mn2+. Write a balanced
equation...
asked 31 minutes ago -
Are some number of occupational illnesses and injuries an
acceptable part of doing business? Why or...
asked 54 minutes ago -
What is the Z score?
Use the following number to answer the question below:
X =...
asked 56 minutes ago -
The speed of the earth in its orbit is 29.8 km / s. Considering a displacement...
asked 1 hour ago
ADVERTISEMENT