
Homework Answers
The statistical software output for this problem is:
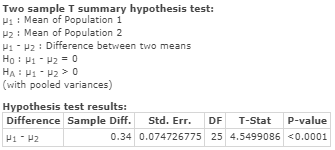
Hence,
t = 4.5499 with 25 degrees of freedom
Option C is correct.
Add Answer to:
16. In order to compare the means of two populations, independent random samples are selected from...
19. In order to compare the means of two populations (each of them is MATH-3334- WA...
 19. In order to compare the means of two populations (each of them is MATH-3334- WA Page 8 of 19 approximately normally distributed), independent random samples are selected from each population, with the following results: 7 12, 7.6, s0.36, 17, 6.5, 0.19. You now use F-test to test Ho : ơ,-ơ2 vs. II. : ơ1+ ơ2. Find the observed value of the test statistic. (a) f 1.3671 with ',-11 and า,-16 degrees of freedom. (b) 1.8947 with m 11 and...
in order to compare the means of two populations, independent random samples of 400 observations are...
in order to compare the means of two populations, independent random samples of 400 observations are selected from each population with the results: sample 1: x1= 5275 and s1= 150 sample 2: x2= 5240 and s2 = 200 a. use a 95% confidence interval to estimate the difference between the population means (m1-m2) interpret the difference. b. test the null hypothesis (m1-m2 = 0) versus the alternative (m1-m2 isn't = to 0). give the p-value of the test and interpret...
In order to compare the means of two populations, independent random samples of 395 observations are...
 In order to compare the means of two populations, independent random samples of 395 observations are selected from each population, with the results found in the table to the right. Complete parts a through e below. Sample 2 x2 = 5,250 2-210 Sample 1 X,5,279 1-140 a. Use a 95% confidence interval to estimate the difference between the population means (μ1-μ2) . Interpret the confidence The confidence interval is Round to one decimal place as needed.) Interpret the confidence interval....
In order to compare the means of two populations, independent random samples of 220 observations are...
In order to compare the means of two populations, independent random samples of 220 observations are selected from each population, with the following results: Sample 1 Sample 2 ?⎯⎯⎯1=0 ?⎯⎯⎯2=5 ?1=165 ?2=200 (a) Use a 97 % confidence interval to estimate the difference between the population means (?1−?2). ≤(?1−?2)≤ (b) Test the null hypothesis: ?0:(?1−?2)=0 versus the alternative hypothesis: ??:(?1−?2)≠0. Using ?=0.03, give the following: the test statistic ?= The final conclusion is: A. There is not sufficient evidence to...
In order to compare the means of two populations, independent random samples of 400 observations are...
In order to compare the means of two populations, independent random samples of 400 observations are selected from each population, with the results found in the table to the right. Complete parts a through e below. Sample 1 overbar x = 5,305 s1= 154 Sample 2 overbar x = 5,266 s2 = 199 a. Use a 95% confidence interval to estimate the difference between the population means (mu 1 - mu 2). Interpret the confidence interval. The confidence interval is...
(1 point) In order to compare the means of two populations, independent random samples of 202...
 (1 point) In order to compare the means of two populations, independent random samples of 202 observations are selected from each population, with the following results: Sample 1 Sample 2 x1 = 4 x2 = 1 $1 = 105 s2 = 150 (a) Use a 90 % confidence interval to estimate the difference between the population means (41-42). < (41 - M2) (b) Test the null hypothesis: Ho : (41 - H2) = 0 versus the alternative hypothesis: H:(W1 -...
In order to compare the means of two populations, independent random samples of 385 observations are...
In order to compare the means of two populations, independent random samples of 385 observations are selected from each population, with the results found in the table to the right. Complete parts a through e. Sample 1 Sample 2 X1 = 5,337 X2 = 5,298 s1 = 157 s2 = 191 a. use a 95% confidence interval to estimate the difference between the population means (u1 - u2). Interpret the confidence interval. b. test the null hypothesis H0: (u1 - u2)...
(2 points) In order to compare the means of two populations, independent random samples of 49...
 (2 points) In order to compare the means of two populations, independent random samples of 49 observations are selected from each population, with the following results: Sample 1 Sample 2 x = 1 *2 = 3 S = 195 140 s2 = (a) Use a 97 % confidence interval to estimate the difference between the population means (41 - H2). ( 4- 42) (b) Test the null hypothesis: H :(#1 - 12) = 0 versus the alternative hypothesis: H, :(...
(1 point) In order to compare the means of two populations, independent random samples of 271...
 (1 point) In order to compare the means of two populations, independent random samples of 271 observations are selected from each population, with the following results: Sample 1 Sample 2 1145 2 120 (a) Use a 99 % confidence interval to estimate the difference between the population means (A-μ). (b) Test the null hypothesis: HO : (μί-12-0 versus the alternative hypothesis. Ha : (μ-μ2)メ (i) the test statistic z () the positive critical z score (ii) the negative critical z...
ulations means, samples were collected for two independent populations where the 4) In order to test...
 ulations means, samples were collected for two independent populations where the 4) In order to test the difference in pop variances are assumed equal and the population normally distributed. The following data resulted. Find the value of the pooled variance ad 99% CI. Population1 x-112 opulation 2 = 107 14 n 25 n- 28
 19. In order to compare the means of two populations (each of them is MATH-3334- WA Page 8 of 19 approximately normally distributed), independent random samples are selected from each population, with the following results: 7 12, 7.6, s0.36, 17, 6.5, 0.19. You now use F-test to test Ho : ơ,-ơ2 vs. II. : ơ1+ ơ2. Find the observed value of the test statistic. (a) f 1.3671 with ',-11 and า,-16 degrees of freedom. (b) 1.8947 with m 11 and...
 In order to compare the means of two populations, independent random samples of 395 observations are selected from each population, with the results found in the table to the right. Complete parts a through e below. Sample 2 x2 = 5,250 2-210 Sample 1 X,5,279 1-140 a. Use a 95% confidence interval to estimate the difference between the population means (μ1-μ2) . Interpret the confidence The confidence interval is Round to one decimal place as needed.) Interpret the confidence interval....
 (1 point) In order to compare the means of two populations, independent random samples of 202 observations are selected from each population, with the following results: Sample 1 Sample 2 x1 = 4 x2 = 1 $1 = 105 s2 = 150 (a) Use a 90 % confidence interval to estimate the difference between the population means (41-42). < (41 - M2) (b) Test the null hypothesis: Ho : (41 - H2) = 0 versus the alternative hypothesis: H:(W1 -...
 (2 points) In order to compare the means of two populations, independent random samples of 49 observations are selected from each population, with the following results: Sample 1 Sample 2 x = 1 *2 = 3 S = 195 140 s2 = (a) Use a 97 % confidence interval to estimate the difference between the population means (41 - H2). ( 4- 42) (b) Test the null hypothesis: H :(#1 - 12) = 0 versus the alternative hypothesis: H, :(...
 (1 point) In order to compare the means of two populations, independent random samples of 271 observations are selected from each population, with the following results: Sample 1 Sample 2 1145 2 120 (a) Use a 99 % confidence interval to estimate the difference between the population means (A-μ). (b) Test the null hypothesis: HO : (μί-12-0 versus the alternative hypothesis. Ha : (μ-μ2)メ (i) the test statistic z () the positive critical z score (ii) the negative critical z...
 ulations means, samples were collected for two independent populations where the 4) In order to test the difference in pop variances are assumed equal and the population normally distributed. The following data resulted. Find the value of the pooled variance ad 99% CI. Population1 x-112 opulation 2 = 107 14 n 25 n- 28
Most questions answered within 3 hours.
-
Which of the following does NOT add to US GDP? A. Saudi Arabia
buys fighter jets...
asked 1 hour ago -
2. Describe market equilibrium in terms of the following
characteristics
d.
How supply and demand interactions...
asked 51 minutes ago -
1a. Create a class named Computer
- Separate declaration from implementation (i.e. Header and CPP
files)...
asked 1 hour ago -
A medical researcher
believes that a drug changes the body's temperature. Seven test
subjects are randomly...
asked 1 hour ago -
A call option on Project Cash Flow Consulting Inc.'s stock (PCF)
has a market price of...
asked 1 hour ago -
A study on the latest fad diet claimed that the amounts of
weight lost by all...
asked 1 hour ago -
give examples of how gene expression is inherited to the next
generation?
asked 1 hour ago -
If a project has _________ IRR(s), we should __________ . Assume
this project is competing with...
asked 1 hour ago -
In the figure, a sound of wavelength 0.700 m is emitted
isotropically by point source S....
asked 2 hours ago -
1) Stock X has a beta of 1.6. If the risk free rate is 3.4
percent...
asked 2 hours ago -
Gallium is produced by the electrolysis of a solution obtained
by dissolving gallium oxide in concentrated...
asked 2 hours ago -
A small company that manufactures juggling equipment makes 19
different types of clubs. The company wants...
asked 2 hours ago