
Homework Answers

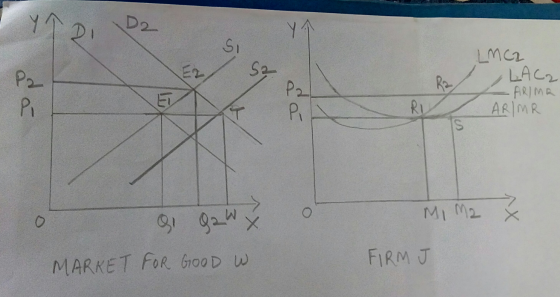
In the above diagram, D1 and S1 are the initial demand and supply curves respectively. The market for good W is in equilibrium at point E1, where demand and supply curves intersect. OP1 is the equilibrium price and OQ1 is the equilibrium quantity. The diagram on the right shows the firm j which is in long run equilibrium. LMC1 is the long run marginal cost and LAC1 is the long run average cost . The firm is in equilibrium at point R1, where LMC=MR.(P1).The equilibrium price is OP1 and equilibrium quantity is OM1. The firm j earns normal profits in the long run i.e., just covering their costs.

An increase in consumer preference for good W, causes the demand curve to shift to right. The new demand curve is D2. The curve D2 and S1 now intersect at point E2. E2 is the new equilibrium point. An increase in demand in the short run causes the equilibrium price to rise to OP2. As firms are fixed in the short run, existing firms increase their production and quantity supplied in the market also increases to OQ2. As the price rises to OP2, the firm j is in equilibrium at point R2, where SMC2=MR(P2). Here in the short run SMC2 is short run marginal cost curve and SAC2 is the short run average cost curve. The equilibrium quantity supplied by firm j increases to OM2. Here the firm is making economic profits as the rise in price exceeds all the costs and hence the firm makes economic profits equal to P1SR2P2 i.e., the shaded portion.
As in the short run, existing firms earn economic profits, new firms would be attracted to enter the industry and earn these economic profits. As new firms enter, the supply curve of the market will shift to the right. This rightward shift of the supply curve with an unchanged demand curve causes the equilibrium price to fall to original equilibrium price and equilibrium quantity increases in the market as more firms have entered.
In the diagarm above, the supply curve of the market shifts to right. The new supply curve is S2. The demand curve D2 and supply curve S2 , intersect at equilibrium point T, whhere equilibrium price is OP1, the original long run equilibrium price. The equilibrium quantity is OW. As the price falls to OP1, the firm j is now at equilibrium at point R1, where LMC2=MR(P1). As price falls, the equilibrium quantity supplies by firm j reduces to OM1. The firm is now earning normal profits i.e., just covering their costs.
Add Answer to:
Return again to the market for good G, and illustrate movement back to long run equilibrium...
Vild is lile pi UIL-IlldX1121118 yudlilily UI Uutput IUI HAAVVdlelleil CUITIPdlly. IS lielildl kel llI IUIlg-Tuileyului...
 Vild is lile pi UIL-IlldX1121118 yudlilily UI Uutput IUI HAAVVdlelleil CUITIPdlly. IS lielildl kel llI IUIlg-Tuileyului IUIII! Why or why not? PROBLEM 2 Assume perfect competition exists for Good G, and assume the market is in long run equilibrium. Depict the market for good G, and indicate initial supply, demand, equilibrium price and quantity with subscript 1. To the right of the market, depict the long run equilibrium situation for firm j that is one firm that produces good G...
T-Mobile Wi-Fi7:28 AM < To Do Hmk 9 Detail Submission Grade i. Set up a market for good D in long...
 T-Mobile Wi-Fi7:28 AM < To Do Hmk 9 Detail Submission Grade i. Set up a market for good D in long run equilibrium assuming perfect competition. ii. Next to the market, set up the situation facing firm d that provides good D. Assume a general decline in preference for good D occurs among consumers ii. Illustrate the short-run dis- equilibrium indicating the situation with subscripts 2. iv. Illustrate the movement to long-run equilibrium indicating the situation with subscripts 3 9...
3. Suppose the market for rolled oats is perfectly competitive and is in a long-run equilibrium....
 3. Suppose the market for rolled oats is perfectly competitive and is in a long-run equilibrium. For the following. be sure to carefully label your graphs and use subscripts as we have done in class! You can give your answers for each part on the same graphs. a. Draw the graphs below that illustrate the market and a representative firm in the initial long-run equilibrium (use the subscript 1 to denote each curve). What profits is the representative firm earning?...
pls review carefully and help pls In perfect competition in long-run equilibrium, can consumer surplus or...
pls review carefully and help pls In perfect competition in long-run equilibrium, can consumer surplus or producer surplus be increased? Explain your answer. In perfect competition in long-run equilibrium, consumer surplus or producer surplus _______ be increased because _______. A. can; a rise in price increases producer surplus and a fall in price increases consumer surplus B. cannot; to do so requires a movement away from the long-run equilibrium C. can; producing more increases both consumer surplus and producer surplus...
Perfect Competition (Please Graph) Please explain and illustrate graphically how the diaper service market has been aff...
Perfect Competition (Please Graph) Please explain and illustrate graphically how the diaper service market has been affected by the decrease in the North American birth rate and the development of disposable diaper. Explain the long-run and the short-run effects of the event, starting from the long run equilibrium. What happens to the price of diaper and the quantity of diaper in the market and a representative individual firm? (Show two diagrams for both market firms and an individual firm)
Cost curves, profits/losses, and long-run equilibrium: a. Draw typical short run average cost and marginal cost...
Cost curves, profits/losses, and long-run equilibrium: a. Draw typical short run average cost and marginal cost curves for a firm (costs on the vertical axis, q on the horizontal axis), such that marginal cost = average cost= 6 at q=10. b. Suppose this firm operates as a perfect competitor in a market with a short run equilibrium price of $5. Illustrate on your graph the area indicating the short run profit or loss experienced by this firm, given the cost...
1. For a perfectly competitive firm, long-run average cost is: LAC = 300 - 20Q +...
1. For a perfectly competitive firm, long-run average cost is: LAC = 300 - 20Q + 1.8Q2, where Q denotes the firm’s output. The firm’s long-run profit-maximizing price is _____. 2. Demand for a good is given by: QD = 50 – 2P and supply by QS = 1P – 10, where P is the market price of the good. In equilibrium, price would be ___. 3. Demand for a good is given by: QD = 50 – 2P and...
17. Market power a. is the capability to increase price without losing all sales. b. exists...
 17. Market power a. is the capability to increase price without losing all sales. b. exists whenever the firm faces a downward-sloping demand curve. c. is greater the less elastic is demand. d. is smaller the more positive is the cross-price elasticity of demand. e. all of the above. 18. A monopoly is maximizing short-run profit at a point on demand where demand elasticity is -3. What is the Lerner index? a. 3 b. 1/3 c. 33.3 d. -3/4 19....
long-run equilibrium diagram
 Using diagrams for both the industry and a representative firm, illustrate competitive long-run equilibrium. Assume constant costs. Given the change indemand in the diagram on the left, show how this affects the representative firm. (draw line)
Quick question I need answered as soon as possible 3. Cost curves, profits/losses, and long-run equilibrium:...
 Quick question I need answered as soon as possible
3. Cost curves, profits/losses, and long-run equilibrium: a. Draw typical short run average cost and marginal cost curves for a firm (costs on the vertical axis, q on the horizontal axis), such that marginal cost = average cost=6 at q=10. (5) b. Suppose this firm operates as a perfect competitor in a market with a short run equilibrium price of $5. Illustrate on your graph the area indicating the short run...
Quick question I need answered as soon as possible
3. Cost curves, profits/losses, and long-run equilibrium: a. Draw typical short run average cost and marginal cost curves for a firm (costs on the vertical axis, q on the horizontal axis), such that marginal cost = average cost=6 at q=10. (5) b. Suppose this firm operates as a perfect competitor in a market with a short run equilibrium price of $5. Illustrate on your graph the area indicating the short run...
 Vild is lile pi UIL-IlldX1121118 yudlilily UI Uutput IUI HAAVVdlelleil CUITIPdlly. IS lielildl kel llI IUIlg-Tuileyului IUIII! Why or why not? PROBLEM 2 Assume perfect competition exists for Good G, and assume the market is in long run equilibrium. Depict the market for good G, and indicate initial supply, demand, equilibrium price and quantity with subscript 1. To the right of the market, depict the long run equilibrium situation for firm j that is one firm that produces good G...
 T-Mobile Wi-Fi7:28 AM < To Do Hmk 9 Detail Submission Grade i. Set up a market for good D in long run equilibrium assuming perfect competition. ii. Next to the market, set up the situation facing firm d that provides good D. Assume a general decline in preference for good D occurs among consumers ii. Illustrate the short-run dis- equilibrium indicating the situation with subscripts 2. iv. Illustrate the movement to long-run equilibrium indicating the situation with subscripts 3 9...
 3. Suppose the market for rolled oats is perfectly competitive and is in a long-run equilibrium. For the following. be sure to carefully label your graphs and use subscripts as we have done in class! You can give your answers for each part on the same graphs. a. Draw the graphs below that illustrate the market and a representative firm in the initial long-run equilibrium (use the subscript 1 to denote each curve). What profits is the representative firm earning?...
 17. Market power a. is the capability to increase price without losing all sales. b. exists whenever the firm faces a downward-sloping demand curve. c. is greater the less elastic is demand. d. is smaller the more positive is the cross-price elasticity of demand. e. all of the above. 18. A monopoly is maximizing short-run profit at a point on demand where demand elasticity is -3. What is the Lerner index? a. 3 b. 1/3 c. 33.3 d. -3/4 19....
 Using diagrams for both the industry and a representative firm, illustrate competitive long-run equilibrium. Assume constant costs. Given the change indemand in the diagram on the left, show how this affects the representative firm. (draw line)
 Quick question I need answered as soon as possible
3. Cost curves, profits/losses, and long-run equilibrium: a. Draw typical short run average cost and marginal cost curves for a firm (costs on the vertical axis, q on the horizontal axis), such that marginal cost = average cost=6 at q=10. (5) b. Suppose this firm operates as a perfect competitor in a market with a short run equilibrium price of $5. Illustrate on your graph the area indicating the short run...
Quick question I need answered as soon as possible
3. Cost curves, profits/losses, and long-run equilibrium: a. Draw typical short run average cost and marginal cost curves for a firm (costs on the vertical axis, q on the horizontal axis), such that marginal cost = average cost=6 at q=10. (5) b. Suppose this firm operates as a perfect competitor in a market with a short run equilibrium price of $5. Illustrate on your graph the area indicating the short run...
Most questions answered within 3 hours.
-
Common-Sized Income Statement
Revenue and expense data for the current calendar year for
Tannenhill Company and...
asked 11 minutes ago -
Find the present value of an annuity due that pays $3000 at the
beginning of each...
asked 20 minutes ago -
A reaction is second order with respect to [A] and half order
with respect to [B]....
asked 19 minutes ago -
In your groups, list the international actors you would expect
to encounter in an emergency logistics...
asked 39 minutes ago -
When one molecule of methane combusts with oxygen, 5.74 X
10-21 J is released as heat....
asked 1 hour ago -
Required information
[The following information applies to the questions
displayed below.]
Satellite Systems modified its model...
asked 56 minutes ago -
High Normal blood pressure is categorized as which of
the following?
140-159/90-99
120/80
130-139/85-89
160/100
asked 1 hour ago -
Please I need help with MATLAB .. PLease help me . Thankyou
Write Matlab code to...
asked 1 hour ago -
You are saving towards purchasing a house and currently have
$20,000 in an account that earns...
asked 1 hour ago -
Draw three resonance structures for each of
the following:
(a) -CH2NO2 (b) CH3CO2CH3
(c) -CH2CO2- (d)...
asked 1 hour ago -
There has been discussion about people moving from Earth to Mars
in the future. An organization...
asked 1 hour ago -
Starting Out with c++ Student Line Up Using Files A teacher has
asked all her students...
asked 1 hour ago