
a. Calculate the appropriate test statistic and interpret the results of the hypothesis test using alpha equals 0.10
.Find the critical values (two decimal places)
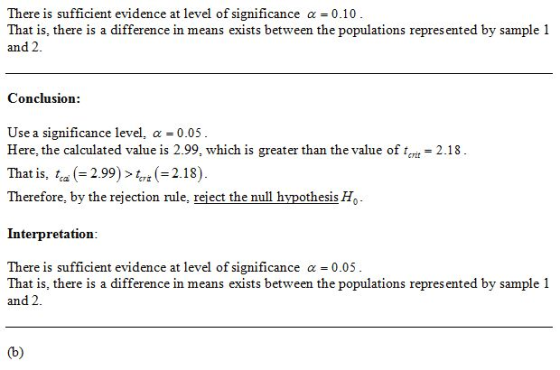
Interpret the results of the hypothesis test using alpha equals 0.05.
b. Identify the p?-value and interpret the result.
c. What assumptions need to be made in order to perform this? procedure?
Homework Answers


Add Answer to:
a. Calculate the appropriate test statistic and interpret the
results of the hypothesis test using alpha...
The following two samples were collected as matched pairs. Complete parts (a) through (d) below. Pair 1 2 3...
The following two samples were collected as matched pairs. Complete parts (a) through (d) below. Pair 1 2 3 4 5 6 7 Sample 1 66 77 88 44 77 88 77 Sample 2 33 55 44 55 55 55 55 Calculate the appropriate test statistic and interpret the results of the hypothesis test using alpha equals 0.01α=0.01.
1) Find the test statistic, t, to test the hypothesis that . Two samples are randomly...
1) Find the test statistic, t, to test the hypothesis that . Two samples are randomly selected and come from populations that are normal. The sample statistics are given below. Do not pool the variances. 25 30 1.5 1.9 A. 3.287 B. 4.361 C. 1.986 D. 2.892 2) The following data represent the muzzle velocity (in feet per second) of rounds fired from a 155-mm gun. For each round, two measurements of the velocity were recorded using two different measuring...
The accompanying table shows two samples that were collected as matched pairs Pair Sample 1 Sample...
The accompanying table shows two samples that were collected as matched pairs Pair Sample 1 Sample 2 1 10 5 2 6 1 3 4 8 4 9 4 5 7 3 6 6 10 7 7 1 8 9 4 Calculate the appropriate test statistic and interpret the results of the hypothesis test using ?=0.01. The test statistic is Identify the? p-value and interpret the result.
Identify p value and interpret result ? 10.3.24-T Question Help * The accompanying table shows two...
 Identify p value and interpret result
? 10.3.24-T Question Help * The accompanying table shows two samples that were collected as matched pairs. Complete parts (a) through (d) below. ?Click the icon to view the data table. a State the null and alternative hypotheses to t if the population represented by Sample 1 has a higher mean than the population represented by Sample 2 Let be the population mean of matched-pair differences for Sample 1 minus Sample 2. Choose the...
Identify p value and interpret result
? 10.3.24-T Question Help * The accompanying table shows two samples that were collected as matched pairs. Complete parts (a) through (d) below. ?Click the icon to view the data table. a State the null and alternative hypotheses to t if the population represented by Sample 1 has a higher mean than the population represented by Sample 2 Let be the population mean of matched-pair differences for Sample 1 minus Sample 2. Choose the...
There is a new not technique for touch screen devices that allows users to mout a...
 There is a new not technique for touch screen devices that allows users to mout a word by siding a finger from letler to ieter. The user's finger is only removed from the keyboard between words. The accompanying data table shows the typing spends of 10 individuals who were measured typing using both methods. Complete parts (8) through (di below m Click the icon to view the datatable 1. Pertom a hypothesis heet usinge -0.05 to determine if the average...
Consider the following hypothesis statement using alpha equals0.05 and data from two independent samples. Assume the...
Consider the following hypothesis statement using alpha equals0.05 and data from two independent samples. Assume the population variances are equal and the populations are normally distributed. Complete parts a and b. Upper H 0 : mu 1 minus mu 2 equals 0 x overbar 1 equals 14.7 x overbar 2 equals 12.0 Upper H 1 : mu 1 minus mu 2 not equals 0 s 1 equals 2.7 s 2 equals 3.3 n 1 equals 20 n 2 equals 15...
Consider the following hypothesis statement using alpha =0.01and data from two independent samples. Assume the population...
Consider the following hypothesis statement using alpha =0.01and data from two independent samples. Assume the population variances are not equal and the populations are normally distributed. Complete parts a and b. Upper H 0 : mu1 - mu 2= 0 x overbar 1= 116.5 x overbar 2 = 121.0 Upper H 1 : mu 1 - mu 2 not equals 0 s 1 = 25.7 s 2 = 15.4 n 1 = 14 n 2 = 21 a. Calculate the...
T-test Unit 85 AS: T-tests In this test you will conduct and interpret T-tests using hypothesis...
 T-test
Unit 85 AS: T-tests In this test you will conduct and interpret T-tests using hypothesis testing and the SPSS progrem. Students will follow the hypothesis testing steps for each probiem. They will compute the problem using the SPSS program. They will write the results in appropriate APA format and interpret the results Steps of hypothesis testing will be typed out in a word document, as well as a copy and paste of the SPSS output For the following problems,...
T-test
Unit 85 AS: T-tests In this test you will conduct and interpret T-tests using hypothesis testing and the SPSS progrem. Students will follow the hypothesis testing steps for each probiem. They will compute the problem using the SPSS program. They will write the results in appropriate APA format and interpret the results Steps of hypothesis testing will be typed out in a word document, as well as a copy and paste of the SPSS output For the following problems,...
Use a t-distribution and the given matched pair sample results to complete the test of the...
Use a t-distribution and the given matched pair sample results to complete the test of the given hypotheses. Assume the results come from random samples, and if the sample sizes are small, assume the underlying distribution of the differences is relatively normal. Assume that differences are computed using d=x1-x2. Test H0 : μd=0 vs Ha : μd≠0 using the paired difference sample results x¯d=10.01, sd=10.3, nd=25. Test Statistic:
Use a t-distribution and the given matched pair sample results to complete the test of the...
 Use a t-distribution and the given matched pair sample results to complete the test of the given hypotheses. Assume the results come from random samples, and if the sample sizes are small, assume the underlying distribution of the differences is relatively normal. Assume that differences are computed using d = x1 - x2. : Md #Ousing the paired difference sample results is = 10.94, Test Ho: Md = 0 vs H Sd = 10.9.nd = 25.
 Identify p value and interpret result
? 10.3.24-T Question Help * The accompanying table shows two samples that were collected as matched pairs. Complete parts (a) through (d) below. ?Click the icon to view the data table. a State the null and alternative hypotheses to t if the population represented by Sample 1 has a higher mean than the population represented by Sample 2 Let be the population mean of matched-pair differences for Sample 1 minus Sample 2. Choose the...
Identify p value and interpret result
? 10.3.24-T Question Help * The accompanying table shows two samples that were collected as matched pairs. Complete parts (a) through (d) below. ?Click the icon to view the data table. a State the null and alternative hypotheses to t if the population represented by Sample 1 has a higher mean than the population represented by Sample 2 Let be the population mean of matched-pair differences for Sample 1 minus Sample 2. Choose the...
 There is a new not technique for touch screen devices that allows users to mout a word by siding a finger from letler to ieter. The user's finger is only removed from the keyboard between words. The accompanying data table shows the typing spends of 10 individuals who were measured typing using both methods. Complete parts (8) through (di below m Click the icon to view the datatable 1. Pertom a hypothesis heet usinge -0.05 to determine if the average...
 T-test
Unit 85 AS: T-tests In this test you will conduct and interpret T-tests using hypothesis testing and the SPSS progrem. Students will follow the hypothesis testing steps for each probiem. They will compute the problem using the SPSS program. They will write the results in appropriate APA format and interpret the results Steps of hypothesis testing will be typed out in a word document, as well as a copy and paste of the SPSS output For the following problems,...
T-test
Unit 85 AS: T-tests In this test you will conduct and interpret T-tests using hypothesis testing and the SPSS progrem. Students will follow the hypothesis testing steps for each probiem. They will compute the problem using the SPSS program. They will write the results in appropriate APA format and interpret the results Steps of hypothesis testing will be typed out in a word document, as well as a copy and paste of the SPSS output For the following problems,...
 Use a t-distribution and the given matched pair sample results to complete the test of the given hypotheses. Assume the results come from random samples, and if the sample sizes are small, assume the underlying distribution of the differences is relatively normal. Assume that differences are computed using d = x1 - x2. : Md #Ousing the paired difference sample results is = 10.94, Test Ho: Md = 0 vs H Sd = 10.9.nd = 25.
Most questions answered within 3 hours.
-
The free energy change for the following reaction at 25 °C, when
[Sn2+] = 1.17 M...
asked 36 minutes ago -
An MNE is this kind of industry when competition in one country
is essentially independent of...
asked 2 hours ago -
. For this set of questions, determine what
proportion of a normal distribution is located betweeneach...
asked 2 hours ago -
A college student is employed as a door-to-door newspaper
salesman. Historical data suggests that the student...
asked 3 hours ago -
MATLAB HW 11 problem using Switch Case and Input commands
Write a script file that calculates...
asked 3 hours ago -
Considering gravitational time dilation, calculate the time that
passes in Earth’s surface while 1 hour passes...
asked 4 hours ago -
Minitab Problem: Take the Lake Hume June rainfall data and find
use the processes outlined in...
asked 4 hours ago -
X Company is trying to decide whether to continue using old
equipment to make Product A...
asked 4 hours ago -
IN PYTHON ONLY !! Program 2: Re-work
program #5 (WeeklyHours) from the previous assignment such that...
asked 5 hours ago -
The average length of time between arrivals at a turnpike
toll-booth is 26 seconds. What is...
asked 7 hours ago -
(a) A piston at 6.1 atm contains a gas that occupies a volume of
3.5 L....
asked 8 hours ago -
Please answer true or false. Words
cannot be changed or added in to make it true...
asked 8 hours ago