
Homework Answers
Add Answer to:
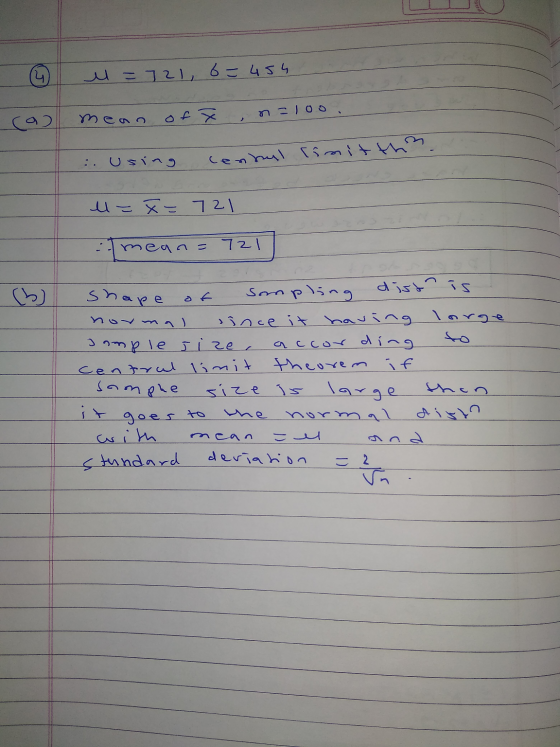
4) The National Health and Nutrition Examination survey estimated dietary intake of ten key nutrients. One...
4. A yogurt cup is advertised as containing 6 oz of yogurt but the machine that...
4. A yogurt cup is advertised as containing 6 oz of yogurt but the machine that fills the cups doesn't put exactly 6 oz of yogurt into each cup. The amount varies slightly. The amount of yogurt follows a normal distribution with a mean that can be set to any desired amount by adjusting the machine. The standard deviation of the amount of the yogurt is always 0.05 oz, regardless of the mean amount. If the company wants to be...
A report announced that the median sales price of new houses sold one year was $221,000,...
 A report announced that the median sales price of new houses sold one year was $221,000, and the mean sales price was $272,400. Assume that the standard deviation of the prices is $100,000. Complete parts (a) through (d) below. if you select samples of n=2, describe the shape of the sampling distribution of X Choose the correct answer below. A. The sampling distribution is skewed to the right (because population was skewed to the right), but less skewed to the...
28. Pulse rates In the latest National Health and Nutrition Exami- nation Survey (NHANES 2013/2014 -...
 28. Pulse rates In the latest National Health and Nutrition Exami- nation Survey (NHANES 2013/2014 - wwwn.cdc.gov/nchs/ nhanes), pulse rate (30 sec rate multiplied by 2) of 2536 U.S. adults averaged 71.6 beats/min with a standard deviation of 11.5 beats/min. (Data in NHANES) a) Can you apply the Central Limit Theorem to describe the distribution of the pulse rates? Why or why not? b) Can you apply the Central Limit Theorem to describe the sampling distribution model for the sample...
4. The annual per capita consumption of sugar by people in the US is a right...
4. The annual per capita consumption of sugar by people in the US is a right skewed distributed with a mean of 150 pounds a standard deviation of 18.5 pounds. Random samples of size 65 are drawn from this population, and the mean of each sample is determined. (3 pts) a. Using Central Limit Theorem, what would the mean, standard deviation, and shape of the sampling distribution be? b. Now assume that random samples of size 110 are drawn instead....
A report announced that the median sales price of new houses sold one year was $211,000,...
A report announced that the median sales price of new houses sold one year was $211,000, and the mean sales price was $271,200. Assume that the standard deviation of the prices is $80,000. Complete parts (a) through (d) below. (a) If you select samples of n = 2, describe the shape of the sampling distribution of Upper X over bar. Choose the correct answer below. A. The sampling distribution will depend on the specific sample and will not have a...
In a 2003 report based on the data from the National Health and Nutrition Examina- tion...
In a 2003 report based on the data from the National Health and Nutrition Examina- tion Survey (NHANES) conducted annually in the US, investigators included the following summary values (in mg) of daily iron intake for the 20-39 age group: Female - Mean = 13.7 Median = 11.7 Standard Deviation = 8.9 Male - Mean = 17.9 Median = 15.7 Standard Deviation = 10.9 (i) Based on these summary measures, does it make sense to assume that daily iron intake...
A survey collects demographic, socioeconomic, dietary, and health-related information on an annual basis. Here is a...
 A survey collects demographic, socioeconomic, dietary, and health-related information on an annual basis. Here is a sample of 20 observations on HDL cholesterol level (mg/dl) obtained from the survey (HDL is "good" cholesterol; the higher its value, the lower the risk for heart disease). 35 49 52 54 66 50 50 47 85 37 46 34 39 44 39 62 95 35 31 48 (a) Calculate a point estimate of the population mean HDL cholesterol level. (b) Making no assumptions...
14. According to the National Health and Nutrition Examination Survey and the Epidemiologic Follow-up Study the...
14. According to the National Health and Nutrition Examination Survey and the Epidemiologic Follow-up Study the mean systolic blood pressure for individuals aged 25 to 59 is 127.3 with a standard deviation of 20.2. A sample measurement of systolic blood pressure from 15 EDUR 8131 Statistics students is taken to learn whether EDUR 8131 students have blood pressure that differs from the national average. (a) Perform a one sample Z test on these data to learn whether a difference in...
PRINTER VERSION BACK NEXT 8th-ed Chapter 07, Supplementary Exercises, Problem 100 According to a Time Magazine/ABT...
 PRINTER VERSION BACK NEXT 8th-ed Chapter 07, Supplementary Exercises, Problem 100 According to a Time Magazine/ABT SRBI poll conducted by telephone during October 9-10, 2011, 735 of adults age 18 years and older said that they are in favor of rain taxes on those with annual incomes of Si million or more to help cut the federal deficit (Time, October 24, 2011). Assume that this percentage is true for the current population of all American adults age 18 years and...
A survey collects demographic, socioeconomic, dietary, and health-related information on an annual basis. Here is a...
 A survey collects demographic, socioeconomic, dietary, and health-related information on an annual basis. Here is a sample of 20 observations on HDL cholesterol level (mg/dl) obtained from the survey (HDL is "good" cholesterol; the higher its value, the lower the risk for heart disease). 34 49 53 55 64 50 50 47 87 37 46 32 40 45 38 64 94 36 31 48 (a) Calculate a point estimate of the population mean HDL cholesterol level. (b) Making no assumptions...
 A report announced that the median sales price of new houses sold one year was $221,000, and the mean sales price was $272,400. Assume that the standard deviation of the prices is $100,000. Complete parts (a) through (d) below. if you select samples of n=2, describe the shape of the sampling distribution of X Choose the correct answer below. A. The sampling distribution is skewed to the right (because population was skewed to the right), but less skewed to the...
 28. Pulse rates In the latest National Health and Nutrition Exami- nation Survey (NHANES 2013/2014 - wwwn.cdc.gov/nchs/ nhanes), pulse rate (30 sec rate multiplied by 2) of 2536 U.S. adults averaged 71.6 beats/min with a standard deviation of 11.5 beats/min. (Data in NHANES) a) Can you apply the Central Limit Theorem to describe the distribution of the pulse rates? Why or why not? b) Can you apply the Central Limit Theorem to describe the sampling distribution model for the sample...
 A survey collects demographic, socioeconomic, dietary, and health-related information on an annual basis. Here is a sample of 20 observations on HDL cholesterol level (mg/dl) obtained from the survey (HDL is "good" cholesterol; the higher its value, the lower the risk for heart disease). 35 49 52 54 66 50 50 47 85 37 46 34 39 44 39 62 95 35 31 48 (a) Calculate a point estimate of the population mean HDL cholesterol level. (b) Making no assumptions...
 PRINTER VERSION BACK NEXT 8th-ed Chapter 07, Supplementary Exercises, Problem 100 According to a Time Magazine/ABT SRBI poll conducted by telephone during October 9-10, 2011, 735 of adults age 18 years and older said that they are in favor of rain taxes on those with annual incomes of Si million or more to help cut the federal deficit (Time, October 24, 2011). Assume that this percentage is true for the current population of all American adults age 18 years and...
 A survey collects demographic, socioeconomic, dietary, and health-related information on an annual basis. Here is a sample of 20 observations on HDL cholesterol level (mg/dl) obtained from the survey (HDL is "good" cholesterol; the higher its value, the lower the risk for heart disease). 34 49 53 55 64 50 50 47 87 37 46 32 40 45 38 64 94 36 31 48 (a) Calculate a point estimate of the population mean HDL cholesterol level. (b) Making no assumptions...
Most questions answered within 3 hours.
-
Write the net ionic equation for the precipitation reaction that
occurs when aqueous solutions of potassium...
asked 5 minutes ago -
it
should be written in c++
Your program should take numbers from the user until the...
asked 11 minutes ago -
Buses are powered by chemical reactions. Define matter and the
four states of matter. What is...
asked 28 minutes ago -
Use conservation of energy to find the velocity of a free point
charge q1 at 22cm...
asked 35 minutes ago -
First, describe policies promoted by governments of the
political right to address economic globalization. Second, describe...
asked 53 minutes ago -
M2-9 Completing T-Accounts LO2-4
Following are the transactions of Dennen, Inc., for the month of
January....
asked 53 minutes ago -
Write a program using python that reads from values from a text
file and plots them...
asked 54 minutes ago -
Look up the density of
the metal of the object used in parts A and B...
asked 53 minutes ago -
Discuss strategic considerations that Amazon and NYC politicians
had. Analyze why the deal between Amazon and...
asked 57 minutes ago -
A combustion reaction is describes as a carbon source reacting
with oxygen and producing carbon dioxide...
asked 1 hour ago -
Buckminsterfullerence is a recently allotrope of carbon in which
carbon atoms form molecules of formula C_60,...
asked 1 hour ago -
Lower Equitorial and Upper Equitorial are the same except Lower
Equitorial has a larger capital stock....
asked 1 hour ago