Commute Time (in minutes) Well-Being Score 6 69.9 14 68.4 26 67.6 34 67.1 47 66.5...
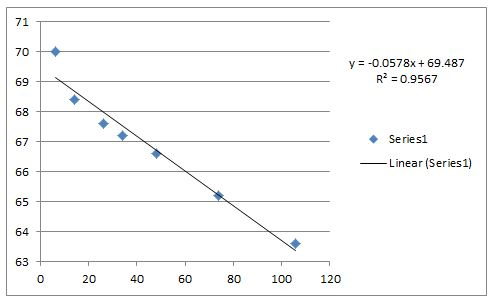
Commute Time (in minutes) Well-Being Score 6 69.9 14 68.4 26 67.6 34 67.1 47 66.5 73 65.2 105 63.5 (a) Which variable is likely the explanatory variable and which is the response variable? A. The explanatory variable is commute time and the response variable is the well-being score because well-being score affects the commute time score. B. The explanatory variable is the well-being score and the response variable is commute time because commute time affects the well-being score. C. The explanatory variable is the well-being score and the response variable is commute time because well-being score affects the commute time. D. The explanatory variable is commute time and the response variable is the well-being score because commute time affects the well-being score. Your answer is correct. (b) Draw a scatter diagram of the data. Which of the following represents the data? A. 60700110Commute Time (min)Score A scatter diagram has a horizontal axis labeled “Commute Time (minutes)” from 60 to 70 in increments of 1 and a vertical axis labeled “Score” from 0 to 110 in increments of 10. The following 7 approximate points are plotted, listed here from left to right: (63.6, 106); (65.2, 74); (66.6, 48); (67.2, 34); (67.6, 26); (68.4, 14); (70.0, 6). The points follow the general pattern of a straight line that falls from left to right. B. 01106070Commute Time (min)Score A scatter diagram has a horizontal axis labeled “Commute Time (minutes)” from 0 to 110 in increments of 10 and a vertical axis labeled “Score” from 60 to 70 in increments of 1. The following 7 approximate points are plotted, listed here from left to right: (6, 70.0); (14, 68.4); (26, 67.6); (34, 67.2); (48, 66.6); (74, 65.2); (106, 63.6). The points follow the general pattern of a straight line that falls from left to right. Your answer is correct. C. 01106070Commute Time (min)Score A scatter diagram has a horizontal axis labeled “Commute Time (minutes)” from 0 to 110 in increments of 10 and a vertical axis labeled “Score” from 60 to 70 in increments of 1. The following 7 approximate points are plotted, listed here from left to right: (6, 63.6); (14, 65.2); (26, 66.6); (34, 67.2); (48, 67.6); (74, 68.4); (106, 70.0). The points follow the general pattern of a curve that rises from left to right at a decreasing rate. D. 01106070Commute Time (min)Score A scatter diagram has a horizontal axis labeled “Commute Time (minutes)” from 0 to 110 in increments of 10 and a vertical axis labeled “Score” from 60 to 70 in increments of 1. The following 7 approximate points are plotted, listed here from left to right: (6, 63.6); (14, 70.0); (26, 65.2); (34, 68.4); (48, 66.6); (74, 67.6); (106, 67.2). The vertical spread of the points decreases from left to right. (c) Determine the linear correlation coefficient between commute time and well-being score. requals nothing (Round to three decimal places as needed.)
Homework Answers
Commute time is increasing as Well being score decreases hence
Well being score is independent and Commute time is dependent
Response variable=Commute time
Explanatory variable= Well Being score

hence option C

corelation coefficient=0.194187
=0.194
using excel correl() function we get 0.194
Add Answer to:
Commute Time (in minutes) Well-Being Score 6 69.9 14 68.4 26
67.6 34 67.1 47 66.5...
Draw a scatter diagram of the data. Which of the following represents the data? OA OB...
 Draw a scatter diagram of the data. Which of the following
represents the data?
OA OB O C. Ο D. 110 110 60 70 110 110 Critical Values for Correlation Coefficient 3 0.997 4 0.950 5 0.878 辟稳ぷ2 11 7 0.754 8 0.707 9 0.666 10 0.632 11 0.602 12 0.576 13 0.553 The data in the table to the right are based on the results of a survey comparing the commute time of adults to Commute their score on...
Draw a scatter diagram of the data. Which of the following
represents the data?
OA OB O C. Ο D. 110 110 60 70 110 110 Critical Values for Correlation Coefficient 3 0.997 4 0.950 5 0.878 辟稳ぷ2 11 7 0.754 8 0.707 9 0.666 10 0.632 11 0.602 12 0.576 13 0.553 The data in the table to the right are based on the results of a survey comparing the commute time of adults to Commute their score on...
The scatter plots below show the results of a survey of 20 randomly selected males ages...
The scatter plots below show the results of a survey of 20 randomly selected males ages 24dash–35. Using age as the explanatory variable, match each graph with the appropriate description. A scatter plot has a horizontal x-axis labeled Age from 24 to 36 in increments of 2 and a vertical y-axis labeled In thousands of units from 0 to 100 in increments of 20. Twenty plotted points with integer horizontal coordinates follow a general pattern of rising from left to...
Which of the following is not a characteristic of the chi-square distribution? Select all correct answers....
Which of the following is not a characteristic of the chi-square distribution? Select all correct answers. Select all that apply: The chi-square curve is symmetrical. The chi-square curve is skewed to the left. The total area under the χ2-curve is equal to the degrees of freedom, df. The total area under the χ2-curve is equal to 1. Does buying CDs depend on whether you own a smartphone or not? A survey asks a group of students if they buy CDs...
The mean waiting time at the drive-through of a fast-food restaurant from the time an order...
The mean waiting time at the drive-through of a fast-food restaurant from the time an order is placed to the time the order is received is 85.5 85.5 seconds. A manager devises a new drive-through system that she she believes will decrease wait time. As a test, she she initiates the new system at her her restaurant and measures the wait time for 10 10 randomly selected orders. The wait times are provided in the table to the right. Complete...
The mean waiting time at the drive-through of a fast-food restaurant from the time an order...
The mean waiting time at the drive-through of a fast-food restaurant from the time an order is placed to the time the order is received is 87.6 seconds. A manager devises a new drive-through system that he believes will decrease wait time. As a test, he initiates the new system at his restaurant and measures the wait time for 10 randomly selected orders. The wait times are provided in the table to the right. Complete parts (a) and (b) below....
The mean waiting time at the drive-through of a fast-food restaurant from the time an order is placed to the time the order is received is 86.286.2 seconds. A manager devises a new drive-throug...
The mean waiting time at the drive-through of a fast-food restaurant from the time an order is placed to the time the order is received is 86.286.2 seconds. A manager devises a new drive-through system that hehe believes will decrease wait time. As a test, hehe initiates the new system at hishis restaurant and measures the wait time for 1010 randomly selected orders. The wait times are provided in the table to the right. Complete parts (a) and (b) below....
 Draw a scatter diagram of the data. Which of the following
represents the data?
OA OB O C. Ο D. 110 110 60 70 110 110 Critical Values for Correlation Coefficient 3 0.997 4 0.950 5 0.878 辟稳ぷ2 11 7 0.754 8 0.707 9 0.666 10 0.632 11 0.602 12 0.576 13 0.553 The data in the table to the right are based on the results of a survey comparing the commute time of adults to Commute their score on...
Draw a scatter diagram of the data. Which of the following
represents the data?
OA OB O C. Ο D. 110 110 60 70 110 110 Critical Values for Correlation Coefficient 3 0.997 4 0.950 5 0.878 辟稳ぷ2 11 7 0.754 8 0.707 9 0.666 10 0.632 11 0.602 12 0.576 13 0.553 The data in the table to the right are based on the results of a survey comparing the commute time of adults to Commute their score on...
Most questions answered within 3 hours.
-
A new president at Big State University has made student
satisfaction with the enrollment and registration...
asked 1 second ago -
Edwards and Bell market a single line of home computer, dubbed
the XL-98. The master budget...
asked 15 seconds ago -
Given the following list of objects and a fixed bin size of
70:
L = [16,...
asked 24 minutes ago -
A mixture of 0.500 mols of NO and 0.100 mols O2 are combined in
a 5...
asked 21 minutes ago -
A city contains 150,000 people (80,000 females and 70,000
males), and 1,500 people die per year...
asked 19 minutes ago -
A certain weak base has a Kb of 8.80×10⁻⁷. What concentration of
this base will produce...
asked 22 minutes ago -
Suppose that the average U.S. household uses 12100 kWh
(kilowatt‑hours) of energy in a year. If...
asked 30 minutes ago -
Patterson Company operates three segments. Income statements for
the segments imply that profitability could be improved...
asked 29 minutes ago -
In 20 words or less, what aspect of your degree course are you
passionate about? civil...
asked 40 minutes ago -
Learning Goal: To understand the relation between the strength
of an acid or a base and...
asked 42 minutes ago -
Discuss the role of integrated marketing communications
(IMC) in a firm’s overall marketing strategy? When executed...
asked 42 minutes ago -
(in Java) We wish to insert the following strings into a hash
table: BEN AL SUE...
asked 51 minutes ago