
Homework Answers
`Hey,
Note: If you have any queries related the answer please do comment. I would be very happy to resolve all your queries.
clc%clears screen
clear all%clears history
close all%closes all files
format long
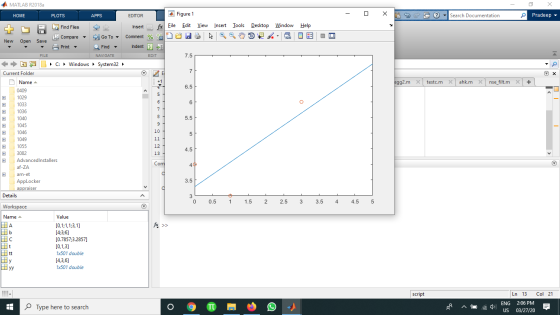
t=[0,1,3];
y=[4,3,6];
A=[t(:) ones(numel(t),1)];
b=y(:);
disp('Coefficients of linear model is');
C=A\b
tt=0:0.01:5;
yy=polyval(C,tt);
plot(tt,yy,t,y,'o');
Kindly revert for any queries
Thanks.
Add Answer to:
i need help with Question 2e? pleass help, i need it ASAP
!!
This worksheet is...
i need these answers ASAP pleass help. Question 2 Consider an economy defined by the following...
 i need these answers ASAP pleass help.
Question 2 Consider an economy defined by the following system of equations: Y = A(Y.r) + G + X(E)- EX*(Y.E) H = H(Y.r) X(E)- EX*(Y, E) + X(r) = 0 Where: Y- national income; A= absorption; G= government expenditure; X= exports; E= nominal exchange rate; X*=imports; H= real money supply; H(o)= real money demand; r= the interest rate; K= capital inflows. Also note: A, > 0: Az <0; X > 0; X; <0;...
i need these answers ASAP pleass help.
Question 2 Consider an economy defined by the following system of equations: Y = A(Y.r) + G + X(E)- EX*(Y.E) H = H(Y.r) X(E)- EX*(Y, E) + X(r) = 0 Where: Y- national income; A= absorption; G= government expenditure; X= exports; E= nominal exchange rate; X*=imports; H= real money supply; H(o)= real money demand; r= the interest rate; K= capital inflows. Also note: A, > 0: Az <0; X > 0; X; <0;...
I really need your help to answer this question for Tables 1 - 5. Thank you...
 I really need your help to answer this question for Tables 1 -
5. Thank you so much I appreciate it!!!
For each set of values, determine whether an exponential
function is a good model. If so, find the function. If not, explain
why.
Part C-Linear and Exponential Models (possible 15 points) You can transform an exponential function into a linear function by taking the logarithm of each side. Since linear models are easy to recognize, you can then determine...
I really need your help to answer this question for Tables 1 -
5. Thank you so much I appreciate it!!!
For each set of values, determine whether an exponential
function is a good model. If so, find the function. If not, explain
why.
Part C-Linear and Exponential Models (possible 15 points) You can transform an exponential function into a linear function by taking the logarithm of each side. Since linear models are easy to recognize, you can then determine...
Please I want someone help me to solve this question a,b,c,d,e I’m not sure about my...
 Please I want someone help me to solve this question
a,b,c,d,e
I’m not sure about my solution
This is the data
# Set directory to data folder
setwd("C:data")
# getwd()
# Read data from csv file
data <- read.csv("SweetPotatoFirmness.csv",header=TRUE,
sep=",")
head(data)
str(data)
# scatterplot of independent and dependent variables
plot(data$pectin,data$firmness,xlab="Pectin,
%",ylab="Firmness")
par(mfrow = c(2, 2)) # Split the plotting panel into a 2 x 2
grid
model <- lm(firmness ~ pectin , data=data)
summary(model)
plot(model)
par(mfrow=c(1,1))
# Residual Plot
data$residuals...
Please I want someone help me to solve this question
a,b,c,d,e
I’m not sure about my solution
This is the data
# Set directory to data folder
setwd("C:data")
# getwd()
# Read data from csv file
data <- read.csv("SweetPotatoFirmness.csv",header=TRUE,
sep=",")
head(data)
str(data)
# scatterplot of independent and dependent variables
plot(data$pectin,data$firmness,xlab="Pectin,
%",ylab="Firmness")
par(mfrow = c(2, 2)) # Split the plotting panel into a 2 x 2
grid
model <- lm(firmness ~ pectin , data=data)
summary(model)
plot(model)
par(mfrow=c(1,1))
# Residual Plot
data$residuals...
can somebody please help me with the question quickly I really need help with this, choose a country and research population data in order to fill out the table below.
 2. Choose a country and research population data in order to fill out the table beloa. Copy the population numbers counted each five years, as shown in the data base, for the years from 1950 to 2000 . Add a column, \(t\), measuring years șince 1945 .b. What is the country you selected? In what part of the world is it? What is the magnitude of its population numbers? \(\left(100,000^{\circ} \mathrm{s}\right.\), millions, hundred millions, billions?) Is it growing or shrinking...
I need help with these questions and could you explain each one also I need to...
 I need help with these questions and could you explain each
one also I need to understand these
https/earn ucr.edu/bbeswebdav/pid-3397982-dt-content-rid-29469576coursesPHYS,002c,020 幻 Click? 14A-3A A A) Which of the following plots corresponds to the sine function: (0 in rad) 2T c) (0 (0 in rad) 3a2 -2 2t 2t read).gv × ㅣㅁ Lecture 14A(wean. × s/earn ucr.edu/bbcswebdav/pid-340403o-dh-content-rid-29465163.1/courses/PHYS.002c.020 Activity 14A-2 The figure to the right is a graph of the position vs. time for an object as it is subjected to SHM...
I need help with these questions and could you explain each
one also I need to understand these
https/earn ucr.edu/bbeswebdav/pid-3397982-dt-content-rid-29469576coursesPHYS,002c,020 幻 Click? 14A-3A A A) Which of the following plots corresponds to the sine function: (0 in rad) 2T c) (0 (0 in rad) 3a2 -2 2t 2t read).gv × ㅣㅁ Lecture 14A(wean. × s/earn ucr.edu/bbcswebdav/pid-340403o-dh-content-rid-29465163.1/courses/PHYS.002c.020 Activity 14A-2 The figure to the right is a graph of the position vs. time for an object as it is subjected to SHM...
Part A is right i just need help with B Consider a radioactive material with a...
 Part A is right i just need help with B
Consider a radioactive material with a decay constant of 2 per month, and every month we add 3 grams of material. Then, the radioactive material is described by the differential equation 2y3. (a) Find an explicit expression of all solutions y of the differential equation above. Denote by c any arbitrary integration constant. vlt) (exp(-2t-c)-3)/2 (b) Suppose the initial amount of material is 4 grams. From all the solutions above,...
Part A is right i just need help with B
Consider a radioactive material with a decay constant of 2 per month, and every month we add 3 grams of material. Then, the radioactive material is described by the differential equation 2y3. (a) Find an explicit expression of all solutions y of the differential equation above. Denote by c any arbitrary integration constant. vlt) (exp(-2t-c)-3)/2 (b) Suppose the initial amount of material is 4 grams. From all the solutions above,...
I do NOT need part a. I really need help on b,c,d,and e though! Thank you
 I do NOT need part a. I really need help on b,c,d,and e though!
Thank you
2. Evaluate the line integral where C is the given curve: BE SURE THAT YOU PARAMETERIZE EACH CURVE! (a) ez dr where C is the arc of the curve z = y3 from (-1,-1) to (1,1); (b) 2,2 d_T + y2 dy where C consists of the arc of the circle x2 + y2-4 from (2,0) to (0,2) followed by the line segment from...
I do NOT need part a. I really need help on b,c,d,and e though!
Thank you
2. Evaluate the line integral where C is the given curve: BE SURE THAT YOU PARAMETERIZE EACH CURVE! (a) ez dr where C is the arc of the curve z = y3 from (-1,-1) to (1,1); (b) 2,2 d_T + y2 dy where C consists of the arc of the circle x2 + y2-4 from (2,0) to (0,2) followed by the line segment from...
I need help at the bottom of the page - Thank you! (a) Draw a scatter...
I need help at the bottom of the page - Thank you! (a) Draw a scatter diagram. Comment on the type of relation that appears to exist between x and y. (b) Given that x = 3.8333, ?? = 2.4014, Sy = 1.8381, and r = −0.9545, determine the least-squares regression line. (c) Graph the least-squares regression line on the scatter diagram drawn in part (a) x y 0 5.9 2 5.7 4 4.3 5 2.8 6 1.7 6 2...
These are the questions from my Math packet I can't figure out. Could someone help and...
These are the questions from my Math packet I can't figure out. Could someone help and explain to me how you got the answer? Thank you! Write an equation to model the situation: The surface area A of a rectangular prism is the sum of the perimeter P and twice the area of the base B. Tell whether the pairing is a function: Input Output -3 4 2 6 -10 8 0 5 Graph the function with the domain x...
I need help with the final part of this problem - (c) Interpret the coefficient of...
I need help with the final part of this problem - (c) Interpret the coefficient of determination and comment on the adequacy of the linear model - all 4 parts. Thank you so much for all the help! The accompanying data represent the weights of various domestic cars and their gas mileages in the city. The linear correlation coefficient between the weight of a car and its miles per gallon in the city is r = −0.963. The least-squares regression...
 i need these answers ASAP pleass help.
Question 2 Consider an economy defined by the following system of equations: Y = A(Y.r) + G + X(E)- EX*(Y.E) H = H(Y.r) X(E)- EX*(Y, E) + X(r) = 0 Where: Y- national income; A= absorption; G= government expenditure; X= exports; E= nominal exchange rate; X*=imports; H= real money supply; H(o)= real money demand; r= the interest rate; K= capital inflows. Also note: A, > 0: Az <0; X > 0; X; <0;...
i need these answers ASAP pleass help.
Question 2 Consider an economy defined by the following system of equations: Y = A(Y.r) + G + X(E)- EX*(Y.E) H = H(Y.r) X(E)- EX*(Y, E) + X(r) = 0 Where: Y- national income; A= absorption; G= government expenditure; X= exports; E= nominal exchange rate; X*=imports; H= real money supply; H(o)= real money demand; r= the interest rate; K= capital inflows. Also note: A, > 0: Az <0; X > 0; X; <0;...
 I really need your help to answer this question for Tables 1 -
5. Thank you so much I appreciate it!!!
For each set of values, determine whether an exponential
function is a good model. If so, find the function. If not, explain
why.
Part C-Linear and Exponential Models (possible 15 points) You can transform an exponential function into a linear function by taking the logarithm of each side. Since linear models are easy to recognize, you can then determine...
I really need your help to answer this question for Tables 1 -
5. Thank you so much I appreciate it!!!
For each set of values, determine whether an exponential
function is a good model. If so, find the function. If not, explain
why.
Part C-Linear and Exponential Models (possible 15 points) You can transform an exponential function into a linear function by taking the logarithm of each side. Since linear models are easy to recognize, you can then determine...
 Please I want someone help me to solve this question
a,b,c,d,e
I’m not sure about my solution
This is the data
# Set directory to data folder
setwd("C:data")
# getwd()
# Read data from csv file
data <- read.csv("SweetPotatoFirmness.csv",header=TRUE,
sep=",")
head(data)
str(data)
# scatterplot of independent and dependent variables
plot(data$pectin,data$firmness,xlab="Pectin,
%",ylab="Firmness")
par(mfrow = c(2, 2)) # Split the plotting panel into a 2 x 2
grid
model <- lm(firmness ~ pectin , data=data)
summary(model)
plot(model)
par(mfrow=c(1,1))
# Residual Plot
data$residuals...
Please I want someone help me to solve this question
a,b,c,d,e
I’m not sure about my solution
This is the data
# Set directory to data folder
setwd("C:data")
# getwd()
# Read data from csv file
data <- read.csv("SweetPotatoFirmness.csv",header=TRUE,
sep=",")
head(data)
str(data)
# scatterplot of independent and dependent variables
plot(data$pectin,data$firmness,xlab="Pectin,
%",ylab="Firmness")
par(mfrow = c(2, 2)) # Split the plotting panel into a 2 x 2
grid
model <- lm(firmness ~ pectin , data=data)
summary(model)
plot(model)
par(mfrow=c(1,1))
# Residual Plot
data$residuals...
 I need help with these questions and could you explain each
one also I need to understand these
https/earn ucr.edu/bbeswebdav/pid-3397982-dt-content-rid-29469576coursesPHYS,002c,020 幻 Click? 14A-3A A A) Which of the following plots corresponds to the sine function: (0 in rad) 2T c) (0 (0 in rad) 3a2 -2 2t 2t read).gv × ㅣㅁ Lecture 14A(wean. × s/earn ucr.edu/bbcswebdav/pid-340403o-dh-content-rid-29465163.1/courses/PHYS.002c.020 Activity 14A-2 The figure to the right is a graph of the position vs. time for an object as it is subjected to SHM...
I need help with these questions and could you explain each
one also I need to understand these
https/earn ucr.edu/bbeswebdav/pid-3397982-dt-content-rid-29469576coursesPHYS,002c,020 幻 Click? 14A-3A A A) Which of the following plots corresponds to the sine function: (0 in rad) 2T c) (0 (0 in rad) 3a2 -2 2t 2t read).gv × ㅣㅁ Lecture 14A(wean. × s/earn ucr.edu/bbcswebdav/pid-340403o-dh-content-rid-29465163.1/courses/PHYS.002c.020 Activity 14A-2 The figure to the right is a graph of the position vs. time for an object as it is subjected to SHM...
 Part A is right i just need help with B
Consider a radioactive material with a decay constant of 2 per month, and every month we add 3 grams of material. Then, the radioactive material is described by the differential equation 2y3. (a) Find an explicit expression of all solutions y of the differential equation above. Denote by c any arbitrary integration constant. vlt) (exp(-2t-c)-3)/2 (b) Suppose the initial amount of material is 4 grams. From all the solutions above,...
Part A is right i just need help with B
Consider a radioactive material with a decay constant of 2 per month, and every month we add 3 grams of material. Then, the radioactive material is described by the differential equation 2y3. (a) Find an explicit expression of all solutions y of the differential equation above. Denote by c any arbitrary integration constant. vlt) (exp(-2t-c)-3)/2 (b) Suppose the initial amount of material is 4 grams. From all the solutions above,...
 I do NOT need part a. I really need help on b,c,d,and e though!
Thank you
2. Evaluate the line integral where C is the given curve: BE SURE THAT YOU PARAMETERIZE EACH CURVE! (a) ez dr where C is the arc of the curve z = y3 from (-1,-1) to (1,1); (b) 2,2 d_T + y2 dy where C consists of the arc of the circle x2 + y2-4 from (2,0) to (0,2) followed by the line segment from...
I do NOT need part a. I really need help on b,c,d,and e though!
Thank you
2. Evaluate the line integral where C is the given curve: BE SURE THAT YOU PARAMETERIZE EACH CURVE! (a) ez dr where C is the arc of the curve z = y3 from (-1,-1) to (1,1); (b) 2,2 d_T + y2 dy where C consists of the arc of the circle x2 + y2-4 from (2,0) to (0,2) followed by the line segment from...
Most questions answered within 3 hours.
-
The blues made its way into many kinds of music. Eric Clapton,
The Beatles, and Elvis...
asked 52 minutes ago -
If you’re standing at the bottom of a hill and asked to evaluate
it while being...
asked 1 hour ago -
1. Which region has taken the lead in the world of
e-waste handling?
a) European Union...
asked 1 hour ago -
A 8.15- g bullet from a 9-mm pistol has a velocity of 366.0 m/s.
It strikes...
asked 3 hours ago -
The outstanding bonds of Alpha Extracts have a yield to maturity
of 7.4 percent and a...
asked 3 hours ago -
The Problem: The Case of the Harmonizing Vacations
Your CEO is exploring partnering with a European...
asked 4 hours ago -
A chemical equation is balanced by adding coefficients in front
of some formulas so that the...
asked 4 hours ago -
From the literature (reference your sources): What are the
lattice parameters of calcite and aragonite? Why...
asked 5 hours ago -
Your system is rejecting the question am asking which is
preceded by a case study. It...
asked 5 hours ago -
3. On January 2, 2000, Larry creates a trust with himself as
trustee. Larry as trustee...
asked 5 hours ago -
A member of the volleyball team spikes the ball. During this
process, she changes the velocity...
asked 5 hours ago -
Are adult gamers less likely to use a gaming console (Xbox,
PlayStation, Wii, etc...) than teen...
asked 6 hours ago