
Homework Answers


Add Answer to:
Please Write clearly.
Thank you
2.10 Functions x(t) and h(t) are both rectangular pulses, as shown...
Please Write clearly Thank you x(t) ht) 2 2 2.12 Functions x(t) and h(t) have the...
 Please Write clearly
Thank you
x(t) ht) 2 2 2.12 Functions x(t) and h(t) have the waveforms shown in Fig. P2.12. Determine and plot y(t) = x(t) *h(t) using the following methods. (a) Integrating the convolution analytically. (b) Integrating the convolution graphically. h 0 0 t(s) t(s) 0 + 1 0 2 Figure P2.12: Waveforms for Problem 2.12.
Please Write clearly
Thank you
x(t) ht) 2 2 2.12 Functions x(t) and h(t) have the waveforms shown in Fig. P2.12. Determine and plot y(t) = x(t) *h(t) using the following methods. (a) Integrating the convolution analytically. (b) Integrating the convolution graphically. h 0 0 t(s) t(s) 0 + 1 0 2 Figure P2.12: Waveforms for Problem 2.12.
Please show all steps needed to take. Please at the minimum please show work for the...
 Please show all steps needed to take. Please at the minimum
please show work for the first three parts. I don't understand
where I am going wrong.
Bonus points if you can support the answer with MATLAB (please show
your code and output graph).
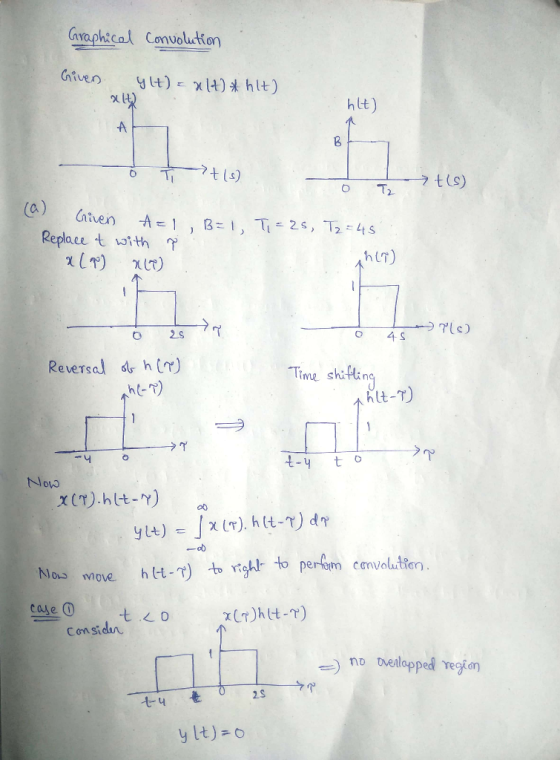
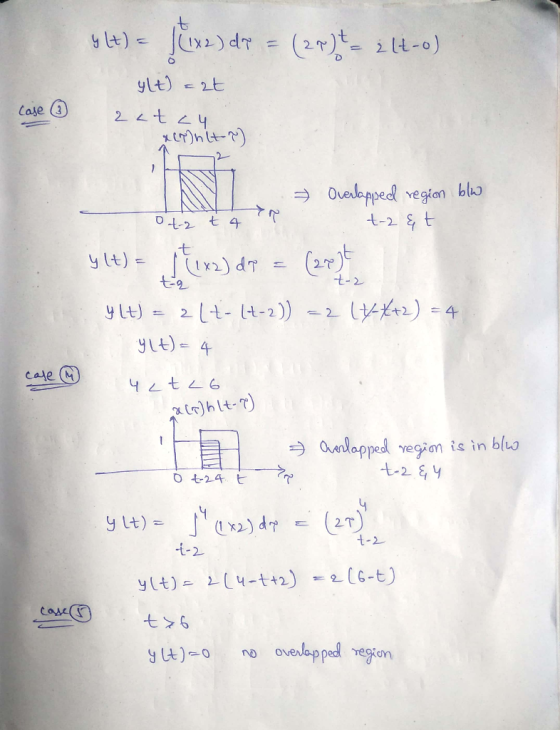
Functions x(t) and h(t) are both rectangular puses as shown below. Apply the graphical convolution to determine yet)-x(t)-h(t) tor: a) A-1, B-, TI-25, T2-4s b) A-2, B-1TI-25, T2-4s (c) A-1, B-2, T1-2s, T2-4 s) Ti a1)...
Please show all steps needed to take. Please at the minimum
please show work for the first three parts. I don't understand
where I am going wrong.
Bonus points if you can support the answer with MATLAB (please show
your code and output graph).
Functions x(t) and h(t) are both rectangular puses as shown below. Apply the graphical convolution to determine yet)-x(t)-h(t) tor: a) A-1, B-, TI-25, T2-4s b) A-2, B-1TI-25, T2-4s (c) A-1, B-2, T1-2s, T2-4 s) Ti a1)...
Q2 (a) Given the signal x(t) and system h(t) as presented in Figure Q2(a). Determine the...
 Q2 (a) Given the signal x(t) and system h(t) as presented in Figure Q2(a). Determine the output y(t) using the graphical representation of convolution integral. (7 marks) x(1) h(t) 1 e-'u(t) e-2 (1) 0 Figure Q2(a) Q2 (b) Consider a system as shown in Figure Q2(b). t2 - 1 x(t) y(t) Advance by 1 second Х Figure Q2(b) Find the input-output relation between x(t) and y(t). (i) (1 mark) Examine whether the system is time variant or time invariant. (5...
9. MATLAB Problem: Use Matlab to find the convolution y(t) of f(t)2tu(t) and h(t) ut1u(t-1). You ...
 9. MATLAB Problem: Use Matlab to find the convolution y(t) of f(t)2tu(t) and h(t) ut1u(t-1). You should submit a printout of the matlab code as an m-file with comments (using %) explaining the role of each line. You should also submit a plot ofy(t) for-l sts 4. You may find Computer Example C2.4 on page 137 useful EXAMPLE FROM BOOK IS BELOW. System Response to External Input: The Zero-Sta 2.4 QComputer Example C2.4 Find c(t) = f(t) * g(t) for...
Just the program code please, thank you Question: How to compute the convolution of these two...
 Just the program code please, thank you
Question: How to compute the convolution of these two signals in MatLa.. (1 bookmark) How to compute the convolution of these two signals in MatLab, without using the conv function/command System response: y(t)= 2tu(t)-3(t-1)u(t-1)-(t2)u(t-2) should be this one according to the book's solutions. Suppose that the system of Figure P3.2(a) has the input x(t) given, in Figure P3.2(b). The impulse response is the unit step fund ion h(t)u(t). Find and sketch the system...
Just the program code please, thank you
Question: How to compute the convolution of these two signals in MatLa.. (1 bookmark) How to compute the convolution of these two signals in MatLab, without using the conv function/command System response: y(t)= 2tu(t)-3(t-1)u(t-1)-(t2)u(t-2) should be this one according to the book's solutions. Suppose that the system of Figure P3.2(a) has the input x(t) given, in Figure P3.2(b). The impulse response is the unit step fund ion h(t)u(t). Find and sketch the system...
04 (2) A rectangular pulses, E (t) is applied to the RC circuit as shown in...
 04 (2) A rectangular pulses, E (t) is applied to the RC circuit as shown in Figure Q4(2). (1) Show that the circuit can be modelled as RC + V = (1) -4(-2) (ii) Calculate the response, or with C) = 0 ning Laplace transform. mark b) Consider the network circuit as shown in Figure Q4 (b) with initial current and their derivatives are zero fort = 0. 1) Show the loop current is can be formulated as dig dt...
1. Assume y(t)x(th(t), where x(0) and h(t) are shown below (a) By foldi ng and sliding...
 1. Assume y(t)x(th(t), where x(0) and h(t) are shown below (a) By foldi ng and sliding h(t), use time convolution to determine the numerical value of y(t) to four decimal places at t O seconds. (llustrate the graphical convolution by including sketches.) (b) Repeat part (a) for t = 3 seconds. (c) Repeat part (a) for 8 seconds. (o 3 t (sec) 7 -l t sec) 5 -&t χ(t)
Find the correlation coefficient ρ between the signal x(t) and each of the four pulses 83(0), and g4(0) shown in Fig. P...
 Find the correlation coefficient ρ between the signal x(t) and each of the four pulses 83(0), and g4(0) shown in Fig. P2.6-1. To provide maximum margin against the noise along the transmission path, which pair of pulses would you select for a binary communication? 2.6-1 820t) 81(t) Figure P2.6-1 x(t) -sin 2T sin 2t 0 0 83() p 84(0) 0.707 0.707 0.5 -0.707
Find the correlation coefficient ρ between the signal x(t) and each of the four pulses 83(0), and...
Find the correlation coefficient ρ between the signal x(t) and each of the four pulses 83(0), and g4(0) shown in Fig. P2.6-1. To provide maximum margin against the noise along the transmission path, which pair of pulses would you select for a binary communication? 2.6-1 820t) 81(t) Figure P2.6-1 x(t) -sin 2T sin 2t 0 0 83() p 84(0) 0.707 0.707 0.5 -0.707
Find the correlation coefficient ρ between the signal x(t) and each of the four pulses 83(0), and...
This multi-part problem also contains (not shown above) the following sub-parts g.) Find v(t) for t >= 0 if the 12.5...
 This multi-part problem also contains (not shown above) the
following sub-parts
g.) Find v(t) for t >= 0 if the 12.5 Ohm
resistor is removed from the circuit
h.) Calculate the frequency of v(t) in
hertz
i.) Calculate the maximum amplitude of v(t) in
volts.
Attached is Figure 8.1
MISPICEM In the circuit in Fig. 8.19, R 12.5 Ω, 820 MULTISIM a. Find v(t) for t20 b. Find the first three values of t for which dv/dt is zero. Let...
This multi-part problem also contains (not shown above) the
following sub-parts
g.) Find v(t) for t >= 0 if the 12.5 Ohm
resistor is removed from the circuit
h.) Calculate the frequency of v(t) in
hertz
i.) Calculate the maximum amplitude of v(t) in
volts.
Attached is Figure 8.1
MISPICEM In the circuit in Fig. 8.19, R 12.5 Ω, 820 MULTISIM a. Find v(t) for t20 b. Find the first three values of t for which dv/dt is zero. Let...
24-8 An LTIC system has impulse response ho shown in Fig. P2.4-8. Lett have units of...
 24-8 An LTIC system has impulse response ho shown in Fig. P2.4-8. Lett have units of second Let the input be x(1) = u(-1-2) and designate the output as yzsr(t) = x(t) *h(t). (a) Use the graphical convolution procedure where h(t) is flipped and shifted to deter- mine yzsr(t). Accurately plot your result. (b) Use the graphical convolution procedure where x(1) is flipped and shifted to deter- mine Yzsr(t). Accurately plot your result. -2 -1 0 1 2 3 4...
 Please Write clearly
Thank you
x(t) ht) 2 2 2.12 Functions x(t) and h(t) have the waveforms shown in Fig. P2.12. Determine and plot y(t) = x(t) *h(t) using the following methods. (a) Integrating the convolution analytically. (b) Integrating the convolution graphically. h 0 0 t(s) t(s) 0 + 1 0 2 Figure P2.12: Waveforms for Problem 2.12.
Please Write clearly
Thank you
x(t) ht) 2 2 2.12 Functions x(t) and h(t) have the waveforms shown in Fig. P2.12. Determine and plot y(t) = x(t) *h(t) using the following methods. (a) Integrating the convolution analytically. (b) Integrating the convolution graphically. h 0 0 t(s) t(s) 0 + 1 0 2 Figure P2.12: Waveforms for Problem 2.12.
 Please show all steps needed to take. Please at the minimum
please show work for the first three parts. I don't understand
where I am going wrong.
Bonus points if you can support the answer with MATLAB (please show
your code and output graph).
Functions x(t) and h(t) are both rectangular puses as shown below. Apply the graphical convolution to determine yet)-x(t)-h(t) tor: a) A-1, B-, TI-25, T2-4s b) A-2, B-1TI-25, T2-4s (c) A-1, B-2, T1-2s, T2-4 s) Ti a1)...
Please show all steps needed to take. Please at the minimum
please show work for the first three parts. I don't understand
where I am going wrong.
Bonus points if you can support the answer with MATLAB (please show
your code and output graph).
Functions x(t) and h(t) are both rectangular puses as shown below. Apply the graphical convolution to determine yet)-x(t)-h(t) tor: a) A-1, B-, TI-25, T2-4s b) A-2, B-1TI-25, T2-4s (c) A-1, B-2, T1-2s, T2-4 s) Ti a1)...
 Q2 (a) Given the signal x(t) and system h(t) as presented in Figure Q2(a). Determine the output y(t) using the graphical representation of convolution integral. (7 marks) x(1) h(t) 1 e-'u(t) e-2 (1) 0 Figure Q2(a) Q2 (b) Consider a system as shown in Figure Q2(b). t2 - 1 x(t) y(t) Advance by 1 second Х Figure Q2(b) Find the input-output relation between x(t) and y(t). (i) (1 mark) Examine whether the system is time variant or time invariant. (5...
 9. MATLAB Problem: Use Matlab to find the convolution y(t) of f(t)2tu(t) and h(t) ut1u(t-1). You should submit a printout of the matlab code as an m-file with comments (using %) explaining the role of each line. You should also submit a plot ofy(t) for-l sts 4. You may find Computer Example C2.4 on page 137 useful EXAMPLE FROM BOOK IS BELOW. System Response to External Input: The Zero-Sta 2.4 QComputer Example C2.4 Find c(t) = f(t) * g(t) for...
 Just the program code please, thank you
Question: How to compute the convolution of these two signals in MatLa.. (1 bookmark) How to compute the convolution of these two signals in MatLab, without using the conv function/command System response: y(t)= 2tu(t)-3(t-1)u(t-1)-(t2)u(t-2) should be this one according to the book's solutions. Suppose that the system of Figure P3.2(a) has the input x(t) given, in Figure P3.2(b). The impulse response is the unit step fund ion h(t)u(t). Find and sketch the system...
Just the program code please, thank you
Question: How to compute the convolution of these two signals in MatLa.. (1 bookmark) How to compute the convolution of these two signals in MatLab, without using the conv function/command System response: y(t)= 2tu(t)-3(t-1)u(t-1)-(t2)u(t-2) should be this one according to the book's solutions. Suppose that the system of Figure P3.2(a) has the input x(t) given, in Figure P3.2(b). The impulse response is the unit step fund ion h(t)u(t). Find and sketch the system...
 04 (2) A rectangular pulses, E (t) is applied to the RC circuit as shown in Figure Q4(2). (1) Show that the circuit can be modelled as RC + V = (1) -4(-2) (ii) Calculate the response, or with C) = 0 ning Laplace transform. mark b) Consider the network circuit as shown in Figure Q4 (b) with initial current and their derivatives are zero fort = 0. 1) Show the loop current is can be formulated as dig dt...
 1. Assume y(t)x(th(t), where x(0) and h(t) are shown below (a) By foldi ng and sliding h(t), use time convolution to determine the numerical value of y(t) to four decimal places at t O seconds. (llustrate the graphical convolution by including sketches.) (b) Repeat part (a) for t = 3 seconds. (c) Repeat part (a) for 8 seconds. (o 3 t (sec) 7 -l t sec) 5 -&t χ(t)
 Find the correlation coefficient ρ between the signal x(t) and each of the four pulses 83(0), and g4(0) shown in Fig. P2.6-1. To provide maximum margin against the noise along the transmission path, which pair of pulses would you select for a binary communication? 2.6-1 820t) 81(t) Figure P2.6-1 x(t) -sin 2T sin 2t 0 0 83() p 84(0) 0.707 0.707 0.5 -0.707
Find the correlation coefficient ρ between the signal x(t) and each of the four pulses 83(0), and...
Find the correlation coefficient ρ between the signal x(t) and each of the four pulses 83(0), and g4(0) shown in Fig. P2.6-1. To provide maximum margin against the noise along the transmission path, which pair of pulses would you select for a binary communication? 2.6-1 820t) 81(t) Figure P2.6-1 x(t) -sin 2T sin 2t 0 0 83() p 84(0) 0.707 0.707 0.5 -0.707
Find the correlation coefficient ρ between the signal x(t) and each of the four pulses 83(0), and...
 This multi-part problem also contains (not shown above) the
following sub-parts
g.) Find v(t) for t >= 0 if the 12.5 Ohm
resistor is removed from the circuit
h.) Calculate the frequency of v(t) in
hertz
i.) Calculate the maximum amplitude of v(t) in
volts.
Attached is Figure 8.1
MISPICEM In the circuit in Fig. 8.19, R 12.5 Ω, 820 MULTISIM a. Find v(t) for t20 b. Find the first three values of t for which dv/dt is zero. Let...
This multi-part problem also contains (not shown above) the
following sub-parts
g.) Find v(t) for t >= 0 if the 12.5 Ohm
resistor is removed from the circuit
h.) Calculate the frequency of v(t) in
hertz
i.) Calculate the maximum amplitude of v(t) in
volts.
Attached is Figure 8.1
MISPICEM In the circuit in Fig. 8.19, R 12.5 Ω, 820 MULTISIM a. Find v(t) for t20 b. Find the first three values of t for which dv/dt is zero. Let...
 24-8 An LTIC system has impulse response ho shown in Fig. P2.4-8. Lett have units of second Let the input be x(1) = u(-1-2) and designate the output as yzsr(t) = x(t) *h(t). (a) Use the graphical convolution procedure where h(t) is flipped and shifted to deter- mine yzsr(t). Accurately plot your result. (b) Use the graphical convolution procedure where x(1) is flipped and shifted to deter- mine Yzsr(t). Accurately plot your result. -2 -1 0 1 2 3 4...
Most questions answered within 3 hours.
-
Let M = 8.00kg, m = 6.00kg, θ = 40.00, and the coefficient of
kinetic friction...
asked 6 minutes ago -
Java. For C through H True or false?
c. Primitive variables must be objects.
d. Integer...
asked 11 minutes ago -
Write a program that turns a 32-bit numeric value (e.g.,
0xFFFFh) and converts it to a...
asked 12 minutes ago -
A motor produces a torque of 0.25 N m at an angular velocity of
7200 revolutions...
asked 26 minutes ago -
***Please answer the below java question***
Are static methods inheritable? Can they be overridden?
asked 28 minutes ago -
In reaching her destination, a backpacker walks with an average
velocity of 1.13 m/s, due west....
asked 28 minutes ago -
Write two C programs that run a
server program and a client program concurrently.
Server program:...
asked 27 minutes ago -
Executive Program Practical Connection Assignment
Subject : Operations Security.
Assignment:
Provide a reflection of at least...
asked 38 minutes ago -
Every time Casey is at bat he has a 0.4 probability of
getting on base (assume...
asked 46 minutes ago -
The Walston Company is to be liquidated and has the following
liabilities:
Income taxes
$
9,400...
asked 53 minutes ago -
If
the more comprehensive data is available in MEPS, why does the NHIS
still exist? How...
asked 1 hour ago -
Koo argues that the Japanese economy in the 1990s suffered from
a balance sheet recession. What...
asked 1 hour ago