
Homework Answers
![t1--1: .01 :-.01; t2-0:.01:4; tl-tl % from-1 % t2 from 0 to 4 t1 to -0.01 t= [t1;t2]; % merge t1 and t2 ut-[zeros (size (t1))](http://img.homeworklib.com/images/a63a129d-6294-450e-9025-94b6d5b06387.png?x-oss-process=image/resize,w_560)
matlab code:
t1=-1:.01:-.01; % t1 from -1 to -0.01
t2=0:.01:4; % t2 from 0 to 4
t1=t1';
t2=t2';
t=[t1;t2]; % merge t1 and t2
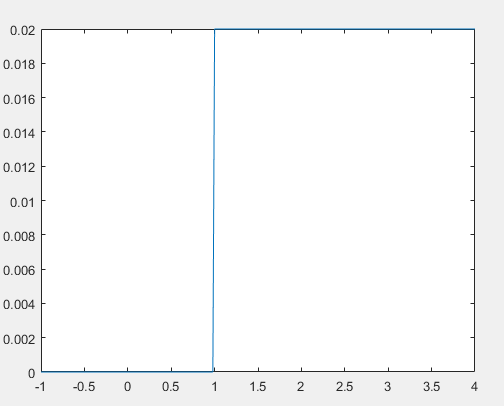
ut=[zeros(size(t1));ones(size(t2))]; %unit step function
%(ut=1 for t>=0 and ut=0 for t<0
ft=2*t'*ut; %ft value
ht=[];
%calculation of ht using ut and t values
i=2;
while i<length(t)
ht(i)=ut(i+1)-ut(i-1)
i=i+1;
end
yt=.01*conv(ut,ht); %convolution
plot(t,yt(1:length(t))); %plot
Add Answer to:
9. MATLAB Problem: Use Matlab to find the convolution y(t) of f(t)2tu(t) and h(t) ut1u(t-1). You ...
Just the program code please, thank you Question: How to compute the convolution of these two...
 Just the program code please, thank you
Question: How to compute the convolution of these two signals in MatLa.. (1 bookmark) How to compute the convolution of these two signals in MatLab, without using the conv function/command System response: y(t)= 2tu(t)-3(t-1)u(t-1)-(t2)u(t-2) should be this one according to the book's solutions. Suppose that the system of Figure P3.2(a) has the input x(t) given, in Figure P3.2(b). The impulse response is the unit step fund ion h(t)u(t). Find and sketch the system...
Just the program code please, thank you
Question: How to compute the convolution of these two signals in MatLa.. (1 bookmark) How to compute the convolution of these two signals in MatLab, without using the conv function/command System response: y(t)= 2tu(t)-3(t-1)u(t-1)-(t2)u(t-2) should be this one according to the book's solutions. Suppose that the system of Figure P3.2(a) has the input x(t) given, in Figure P3.2(b). The impulse response is the unit step fund ion h(t)u(t). Find and sketch the system...
Solve using Matlab Use the forward Euler method, Vi+,-Vi+(4+1-tinti ,Vi) for i= 0,1,2, , taking yo y(to) to be the initial condition, to approximate the solution at t-2 of the IVP y'=y-t2 + 1, 0-...
 Solve using Matlab
Use the forward Euler method, Vi+,-Vi+(4+1-tinti ,Vi) for i= 0,1,2, , taking yo y(to) to be the initial condition, to approximate the solution at t-2 of the IVP y'=y-t2 + 1, 0-t-2, y(0) = 0.5. Use N = 2k, k = 1, 2, , 20 equispaced time steps (so to = 0 and tN-1 = 2). Make a convergence plot, computing the error by comparing with the exact solution, y: t1)2 -exp(t)/2, and plotting the error as...
Solve using Matlab
Use the forward Euler method, Vi+,-Vi+(4+1-tinti ,Vi) for i= 0,1,2, , taking yo y(to) to be the initial condition, to approximate the solution at t-2 of the IVP y'=y-t2 + 1, 0-t-2, y(0) = 0.5. Use N = 2k, k = 1, 2, , 20 equispaced time steps (so to = 0 and tN-1 = 2). Make a convergence plot, computing the error by comparing with the exact solution, y: t1)2 -exp(t)/2, and plotting the error as...
Find the convolution f(t) *g(t) for the following problem. f(t) = g(t) = 9 sint (f*g)(t)...
 Find the convolution f(t) *g(t) for the following problem. f(t) = g(t) = 9 sint (f*g)(t) =
Problem 4: Evaluation of the convolution integral too y(t) = (f * h)(t) = f(t)h(t –...
 Problem 4: Evaluation of the convolution integral too y(t) = (f * h)(t) = f(t)h(t – 7)dt is greatly simplified when either the input f(t) or impulse response h(t) is the sum of weighted impulse functions. This fact will be used later in the semester when we study the operation of communication systems using Fourier analysis methods. a) Use the convolution integral to prove that f(t) *8(t – T) = f(t – T) and 8(t – T) *h(t) = h(t...
Problem 4 Use Matlab to find the result on graphical convolution between pairs of signals given...
 Problem 4 Use Matlab to find the result on graphical convolution between pairs of signals given below. 2 (t) si () 1 (0) -2 0 f (a) 11 2 (t) -21
4. Use the convolution integral to find f, where f = g*h, and g(t) = et...
 4. Use the convolution integral to find f, where f = g*h, and g(t) = et ult) h(t) = e-2t u(t) Note that both of these are causal to simplify the integration.
Problem 4 Given: St t(t) # -t e g(t) a) Compute fg () using convolution integral method. b) Compute g*f () with Laplace transform. o) What are the differences between the results of questions (a)...
 Problem 4 Given: St t(t) # -t e g(t) a) Compute fg () using convolution integral method. b) Compute g*f () with Laplace transform. o) What are the differences between the results of questions (a) and (0) above? d) Find the Laplace transform of the following function: (t 0 to +oo) e dt e) Find the equivalent solution of (d) using MATLAB method) (find 2 methods)
Problem 4 Given: St t(t) # -t e g(t) a) Compute fg () using...
Problem 4 Given: St t(t) # -t e g(t) a) Compute fg () using convolution integral method. b) Compute g*f () with Laplace transform. o) What are the differences between the results of questions (a) and (0) above? d) Find the Laplace transform of the following function: (t 0 to +oo) e dt e) Find the equivalent solution of (d) using MATLAB method) (find 2 methods)
Problem 4 Given: St t(t) # -t e g(t) a) Compute fg () using...
Matlab help 1) Given the functions x1()= tu()-tuft-1) and X2(t)=10e-5,11(), do the following: 1. Plotx,(t) and x2(0) using MATLAB 2. Use MATLAB to find and plot x(0=x:@*.x2(t), where * denotes co...
 Matlab help
1) Given the functions x1()= tu()-tuft-1) and X2(t)=10e-5,11(), do the following: 1. Plotx,(t) and x2(0) using MATLAB 2. Use MATLAB to find and plot x(0=x:@*.x2(t), where * denotes convolution. 3. Find x(t)=x;()*X2(1) by hand using Laplace transforms. 4. Plot the result of part 3 in MATLAB and compare it to that found in part 2. 2) Given the transfer function shown below, do the following: 1. Find the system's impulse response and plot it using MATLAB 2. Repeat...
Matlab help
1) Given the functions x1()= tu()-tuft-1) and X2(t)=10e-5,11(), do the following: 1. Plotx,(t) and x2(0) using MATLAB 2. Use MATLAB to find and plot x(0=x:@*.x2(t), where * denotes convolution. 3. Find x(t)=x;()*X2(1) by hand using Laplace transforms. 4. Plot the result of part 3 in MATLAB and compare it to that found in part 2. 2) Given the transfer function shown below, do the following: 1. Find the system's impulse response and plot it using MATLAB 2. Repeat...
To plot a figure of a function y=f(t) in an interval a and b in MATLAB,...
 To plot a figure of a function y=f(t) in an interval a and b in MATLAB, one should find n-1 points of t between a and b and then find the corresponding values to plot the figure. Below shows an example of a sin function in the range of 0 and 1 with 1000 increments, as well as the figure. >> t = 0:0.001:1; >> y = sin(2*pi*2*t); >> figure >> plot(t, y) 0 02 04 06 08 Demonstrate a...
For b.), it is from 20 to -20. Not 10 to -10 3. (40 points) Consider the time signals shown in Figure3 h(t) 10 z(t) 2 -10 Figure 3 Find y(t)-h(t)sz(t) using the graphical approach of the convolution i...
 For b.), it is from 20 to -20.
Not 10 to -10
3. (40 points) Consider the time signals shown in Figure3 h(t) 10 z(t) 2 -10 Figure 3 Find y(t)-h(t)sz(t) using the graphical approach of the convolution integral (by hand). You can use MATLAB to ver
3. (40 points) Consider the time signals shown in Figure3 h(t) 10 z(t) 2 -10 Figure 3 Find y(t)-h(t)sz(t) using the graphical approach of the convolution integral (by hand). You can use MATLAB...
For b.), it is from 20 to -20.
Not 10 to -10
3. (40 points) Consider the time signals shown in Figure3 h(t) 10 z(t) 2 -10 Figure 3 Find y(t)-h(t)sz(t) using the graphical approach of the convolution integral (by hand). You can use MATLAB to ver
3. (40 points) Consider the time signals shown in Figure3 h(t) 10 z(t) 2 -10 Figure 3 Find y(t)-h(t)sz(t) using the graphical approach of the convolution integral (by hand). You can use MATLAB...
 Just the program code please, thank you
Question: How to compute the convolution of these two signals in MatLa.. (1 bookmark) How to compute the convolution of these two signals in MatLab, without using the conv function/command System response: y(t)= 2tu(t)-3(t-1)u(t-1)-(t2)u(t-2) should be this one according to the book's solutions. Suppose that the system of Figure P3.2(a) has the input x(t) given, in Figure P3.2(b). The impulse response is the unit step fund ion h(t)u(t). Find and sketch the system...
Just the program code please, thank you
Question: How to compute the convolution of these two signals in MatLa.. (1 bookmark) How to compute the convolution of these two signals in MatLab, without using the conv function/command System response: y(t)= 2tu(t)-3(t-1)u(t-1)-(t2)u(t-2) should be this one according to the book's solutions. Suppose that the system of Figure P3.2(a) has the input x(t) given, in Figure P3.2(b). The impulse response is the unit step fund ion h(t)u(t). Find and sketch the system...
 Solve using Matlab
Use the forward Euler method, Vi+,-Vi+(4+1-tinti ,Vi) for i= 0,1,2, , taking yo y(to) to be the initial condition, to approximate the solution at t-2 of the IVP y'=y-t2 + 1, 0-t-2, y(0) = 0.5. Use N = 2k, k = 1, 2, , 20 equispaced time steps (so to = 0 and tN-1 = 2). Make a convergence plot, computing the error by comparing with the exact solution, y: t1)2 -exp(t)/2, and plotting the error as...
Solve using Matlab
Use the forward Euler method, Vi+,-Vi+(4+1-tinti ,Vi) for i= 0,1,2, , taking yo y(to) to be the initial condition, to approximate the solution at t-2 of the IVP y'=y-t2 + 1, 0-t-2, y(0) = 0.5. Use N = 2k, k = 1, 2, , 20 equispaced time steps (so to = 0 and tN-1 = 2). Make a convergence plot, computing the error by comparing with the exact solution, y: t1)2 -exp(t)/2, and plotting the error as...
 Find the convolution f(t) *g(t) for the following problem. f(t) = g(t) = 9 sint (f*g)(t) =
 Problem 4: Evaluation of the convolution integral too y(t) = (f * h)(t) = f(t)h(t – 7)dt is greatly simplified when either the input f(t) or impulse response h(t) is the sum of weighted impulse functions. This fact will be used later in the semester when we study the operation of communication systems using Fourier analysis methods. a) Use the convolution integral to prove that f(t) *8(t – T) = f(t – T) and 8(t – T) *h(t) = h(t...
 Problem 4 Use Matlab to find the result on graphical convolution between pairs of signals given below. 2 (t) si () 1 (0) -2 0 f (a) 11 2 (t) -21
 4. Use the convolution integral to find f, where f = g*h, and g(t) = et ult) h(t) = e-2t u(t) Note that both of these are causal to simplify the integration.
 Problem 4 Given: St t(t) # -t e g(t) a) Compute fg () using convolution integral method. b) Compute g*f () with Laplace transform. o) What are the differences between the results of questions (a) and (0) above? d) Find the Laplace transform of the following function: (t 0 to +oo) e dt e) Find the equivalent solution of (d) using MATLAB method) (find 2 methods)
Problem 4 Given: St t(t) # -t e g(t) a) Compute fg () using...
Problem 4 Given: St t(t) # -t e g(t) a) Compute fg () using convolution integral method. b) Compute g*f () with Laplace transform. o) What are the differences between the results of questions (a) and (0) above? d) Find the Laplace transform of the following function: (t 0 to +oo) e dt e) Find the equivalent solution of (d) using MATLAB method) (find 2 methods)
Problem 4 Given: St t(t) # -t e g(t) a) Compute fg () using...
 Matlab help
1) Given the functions x1()= tu()-tuft-1) and X2(t)=10e-5,11(), do the following: 1. Plotx,(t) and x2(0) using MATLAB 2. Use MATLAB to find and plot x(0=x:@*.x2(t), where * denotes convolution. 3. Find x(t)=x;()*X2(1) by hand using Laplace transforms. 4. Plot the result of part 3 in MATLAB and compare it to that found in part 2. 2) Given the transfer function shown below, do the following: 1. Find the system's impulse response and plot it using MATLAB 2. Repeat...
Matlab help
1) Given the functions x1()= tu()-tuft-1) and X2(t)=10e-5,11(), do the following: 1. Plotx,(t) and x2(0) using MATLAB 2. Use MATLAB to find and plot x(0=x:@*.x2(t), where * denotes convolution. 3. Find x(t)=x;()*X2(1) by hand using Laplace transforms. 4. Plot the result of part 3 in MATLAB and compare it to that found in part 2. 2) Given the transfer function shown below, do the following: 1. Find the system's impulse response and plot it using MATLAB 2. Repeat...
 To plot a figure of a function y=f(t) in an interval a and b in MATLAB, one should find n-1 points of t between a and b and then find the corresponding values to plot the figure. Below shows an example of a sin function in the range of 0 and 1 with 1000 increments, as well as the figure. >> t = 0:0.001:1; >> y = sin(2*pi*2*t); >> figure >> plot(t, y) 0 02 04 06 08 Demonstrate a...
 For b.), it is from 20 to -20.
Not 10 to -10
3. (40 points) Consider the time signals shown in Figure3 h(t) 10 z(t) 2 -10 Figure 3 Find y(t)-h(t)sz(t) using the graphical approach of the convolution integral (by hand). You can use MATLAB to ver
3. (40 points) Consider the time signals shown in Figure3 h(t) 10 z(t) 2 -10 Figure 3 Find y(t)-h(t)sz(t) using the graphical approach of the convolution integral (by hand). You can use MATLAB...
For b.), it is from 20 to -20.
Not 10 to -10
3. (40 points) Consider the time signals shown in Figure3 h(t) 10 z(t) 2 -10 Figure 3 Find y(t)-h(t)sz(t) using the graphical approach of the convolution integral (by hand). You can use MATLAB to ver
3. (40 points) Consider the time signals shown in Figure3 h(t) 10 z(t) 2 -10 Figure 3 Find y(t)-h(t)sz(t) using the graphical approach of the convolution integral (by hand). You can use MATLAB...
Most questions answered within 3 hours.
-
among the three different ways to link CSS specifications to an
HTML document (inline CSS, document...
asked 1 minute ago -
For each of the following strong base solutions, determine
[OH−],[H3O+], pH, and pOH 4.8 x 10^-4...
asked 6 minutes ago -
The magnitude of the electric field inside a capacitor is 6.6 x
106 N/C. What is...
asked 6 minutes ago -
On the night of April 18, 1775, a signal was to be sent from the
Old...
asked 11 minutes ago -
Organizations may have only a few products or many products in a
product line. Consider Campbell...
asked 20 minutes ago -
could you please help me to explain the nmr splitting
integration and chemical shift and assignment...
asked 16 minutes ago -
A
29.0 cm diameter coil consists of 23 turns of cylindrical copper
wire 2.00 mm in...
asked 22 minutes ago -
(1) Write the net ionic equation for the reaction that occurs
when equal volumes of 0.191...
asked 28 minutes ago -
Q1
Two of your friends each received the results of their
first midterm exam this term....
asked 39 minutes ago -
A 0.500-kg object, suspended from an ideal spring of spring
constant 30.2 N/m, is oscillating vertically....
asked 37 minutes ago -
Please help and show work. I keep getting the wrong answers for
these problems
1. Cell...
asked 34 minutes ago -
If there is a SNP in the read with respect to the
reference genome, how would a...
asked 36 minutes ago