
Homework Answers


Add Answer to:
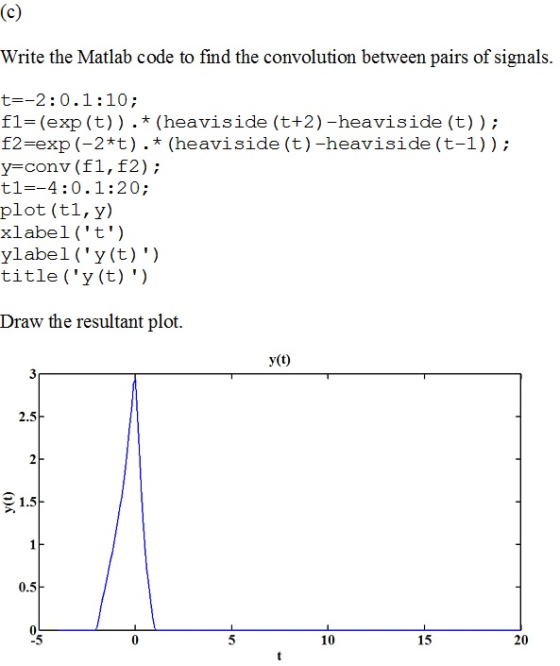
Problem 4 Use Matlab to find the result on graphical convolution between pairs of signals given...
(a) Find the convolution of these two signals, and sketch the result.
Circular vs. Linear ConvolutionConsider sequences(x[0], x[1], x[2], x[3], x[4], x[5], x[6], x[7])=(1,1,1,1,0,0,0,0)and(h[0], h[1], h[2], h[3], h[4], h[5], h[6], h[7])=(1,2,3,4,3,2,1,0)where x[n]=0 for n ∉\{0, …, 7\} and h[n]=0 for n ∉\{0, ..., 7\}.(a) Find the convolution of these two signals, and sketch the result.(b) Find the 8-point circular convolution of these two signals, and sketch the result.(c) Assume that each of the signals has been zero padded up to a length 16. Find the 16 -point circular convolution of these two...
9. MATLAB Problem: Use Matlab to find the convolution y(t) of f(t)2tu(t) and h(t) ut1u(t-1). You ...
 9. MATLAB Problem: Use Matlab to find the convolution y(t) of f(t)2tu(t) and h(t) ut1u(t-1). You should submit a printout of the matlab code as an m-file with comments (using %) explaining the role of each line. You should also submit a plot ofy(t) for-l sts 4. You may find Computer Example C2.4 on page 137 useful EXAMPLE FROM BOOK IS BELOW. System Response to External Input: The Zero-Sta 2.4 QComputer Example C2.4 Find c(t) = f(t) * g(t) for...
Please show using MATLAB Answer 7. Obtain the convolution of the pairs of signals in Figure 7 h(t) a(t) 0 2 h(t) r(t) 0 0 Figure 7: Signal pairs Therefore, y(t) = 0 otherwise 7. Obtain the convol...
 Please show using MATLAB Answer
7. Obtain the convolution of the pairs of signals in Figure 7 h(t) a(t) 0 2 h(t) r(t) 0 0 Figure 7: Signal pairs Therefore, y(t) = 0 otherwise
7. Obtain the convolution of the pairs of signals in Figure 7 h(t) a(t) 0 2 h(t) r(t) 0 0 Figure 7: Signal pairs
Therefore, y(t) = 0 otherwise
Please show using MATLAB Answer
7. Obtain the convolution of the pairs of signals in Figure 7 h(t) a(t) 0 2 h(t) r(t) 0 0 Figure 7: Signal pairs Therefore, y(t) = 0 otherwise
7. Obtain the convolution of the pairs of signals in Figure 7 h(t) a(t) 0 2 h(t) r(t) 0 0 Figure 7: Signal pairs
Therefore, y(t) = 0 otherwise
For b.), it is from 20 to -20. Not 10 to -10 3. (40 points) Consider the time signals shown in Figure3 h(t) 10 z(t) 2 -10 Figure 3 Find y(t)-h(t)sz(t) using the graphical approach of the convolution i...
 For b.), it is from 20 to -20.
Not 10 to -10
3. (40 points) Consider the time signals shown in Figure3 h(t) 10 z(t) 2 -10 Figure 3 Find y(t)-h(t)sz(t) using the graphical approach of the convolution integral (by hand). You can use MATLAB to ver
3. (40 points) Consider the time signals shown in Figure3 h(t) 10 z(t) 2 -10 Figure 3 Find y(t)-h(t)sz(t) using the graphical approach of the convolution integral (by hand). You can use MATLAB...
For b.), it is from 20 to -20.
Not 10 to -10
3. (40 points) Consider the time signals shown in Figure3 h(t) 10 z(t) 2 -10 Figure 3 Find y(t)-h(t)sz(t) using the graphical approach of the convolution integral (by hand). You can use MATLAB to ver
3. (40 points) Consider the time signals shown in Figure3 h(t) 10 z(t) 2 -10 Figure 3 Find y(t)-h(t)sz(t) using the graphical approach of the convolution integral (by hand). You can use MATLAB...
************PLEASE INCLUDE MATLAB CODES*********** Find y(n) by Performing graphical convolution of the following sequences and confirm...
************PLEASE INCLUDE MATLAB CODES*********** Find y(n) by Performing graphical convolution of the following sequences and confirm your results via Matlab (Include Matlab code and graphics). Bold sample represent the sample value at n = 0 a. x(n) = {1, 2, 1, 1}, h(n) = {1, -1, 0, 0, 1, 1} b. x(n) = {1, 1, 0, 1, 1}, h(n) = {1, 2, 3, 2, 1}
3. This is an exercise about convolution. Consider the signals f and g below, both periodic with ...
 3. This is an exercise about convolution. Consider the signals f and g below, both periodic with T -2. t sin(2t), -1-t 〈 0; (1+1), It _ 0.51, 一1 〈 t 〈 0; 0
Problem 4 Given: St t(t) # -t e g(t) a) Compute fg () using convolution integral method. b) Compute g*f () with Laplace transform. o) What are the differences between the results of questions (a)...
 Problem 4 Given: St t(t) # -t e g(t) a) Compute fg () using convolution integral method. b) Compute g*f () with Laplace transform. o) What are the differences between the results of questions (a) and (0) above? d) Find the Laplace transform of the following function: (t 0 to +oo) e dt e) Find the equivalent solution of (d) using MATLAB method) (find 2 methods)
Problem 4 Given: St t(t) # -t e g(t) a) Compute fg () using...
Problem 4 Given: St t(t) # -t e g(t) a) Compute fg () using convolution integral method. b) Compute g*f () with Laplace transform. o) What are the differences between the results of questions (a) and (0) above? d) Find the Laplace transform of the following function: (t 0 to +oo) e dt e) Find the equivalent solution of (d) using MATLAB method) (find 2 methods)
Problem 4 Given: St t(t) # -t e g(t) a) Compute fg () using...
Compute the convolution using the CONVOLUTIONAL SUM method Problem 2.19. Compute the convolution y(n) of the...
 Compute the convolution using the CONVOLUTIONAL SUM
method
Problem 2.19. Compute the convolution y(n) of the signals -3< < 1 (n) = Ja". 0 . Otherwise hin) = w Si, 0<n<4 0 otherwise where a is a given parameter.
Compute the convolution using the CONVOLUTIONAL SUM
method
Problem 2.19. Compute the convolution y(n) of the signals -3< < 1 (n) = Ja". 0 . Otherwise hin) = w Si, 0<n<4 0 otherwise where a is a given parameter.
Find the convolution integral of the following figure pairs: use the graph method y(t) X(t) 0...
 Find the convolution integral of the following figure pairs: use
the graph method
y(t) X(t) 0 1 2 3 4
Find the convolution integral of the following figure pairs: use
the graph method
y(t) X(t) 0 1 2 3 4
Help please! Problem No. P1: Convolution Below is a Matlab code for performing convolution of two...
 Help please!
Problem No. P1: Convolution Below is a Matlab code for performing convolution of two sequences. function [y,ny] conv m(x,nx,h,nh) % Modified convolution routine for signal processing [y,ny] convolution result x,nx] first signal Dh,nh] second signal nyb nx(1)+nh(1); nye nx(length(x)) y-conv (x,h); Use the code to perform convolution of r) 1.2,3,4 and h( 3.2,1 nh (length(h));
Help please!
Problem No. P1: Convolution Below is a Matlab code for performing convolution of two sequences. function [y,ny] conv m(x,nx,h,nh) % Modified convolution routine for signal processing [y,ny] convolution result x,nx] first signal Dh,nh] second signal nyb nx(1)+nh(1); nye nx(length(x)) y-conv (x,h); Use the code to perform convolution of r) 1.2,3,4 and h( 3.2,1 nh (length(h));
 9. MATLAB Problem: Use Matlab to find the convolution y(t) of f(t)2tu(t) and h(t) ut1u(t-1). You should submit a printout of the matlab code as an m-file with comments (using %) explaining the role of each line. You should also submit a plot ofy(t) for-l sts 4. You may find Computer Example C2.4 on page 137 useful EXAMPLE FROM BOOK IS BELOW. System Response to External Input: The Zero-Sta 2.4 QComputer Example C2.4 Find c(t) = f(t) * g(t) for...
 Please show using MATLAB Answer
7. Obtain the convolution of the pairs of signals in Figure 7 h(t) a(t) 0 2 h(t) r(t) 0 0 Figure 7: Signal pairs Therefore, y(t) = 0 otherwise
7. Obtain the convolution of the pairs of signals in Figure 7 h(t) a(t) 0 2 h(t) r(t) 0 0 Figure 7: Signal pairs
Therefore, y(t) = 0 otherwise
Please show using MATLAB Answer
7. Obtain the convolution of the pairs of signals in Figure 7 h(t) a(t) 0 2 h(t) r(t) 0 0 Figure 7: Signal pairs Therefore, y(t) = 0 otherwise
7. Obtain the convolution of the pairs of signals in Figure 7 h(t) a(t) 0 2 h(t) r(t) 0 0 Figure 7: Signal pairs
Therefore, y(t) = 0 otherwise
 For b.), it is from 20 to -20.
Not 10 to -10
3. (40 points) Consider the time signals shown in Figure3 h(t) 10 z(t) 2 -10 Figure 3 Find y(t)-h(t)sz(t) using the graphical approach of the convolution integral (by hand). You can use MATLAB to ver
3. (40 points) Consider the time signals shown in Figure3 h(t) 10 z(t) 2 -10 Figure 3 Find y(t)-h(t)sz(t) using the graphical approach of the convolution integral (by hand). You can use MATLAB...
For b.), it is from 20 to -20.
Not 10 to -10
3. (40 points) Consider the time signals shown in Figure3 h(t) 10 z(t) 2 -10 Figure 3 Find y(t)-h(t)sz(t) using the graphical approach of the convolution integral (by hand). You can use MATLAB to ver
3. (40 points) Consider the time signals shown in Figure3 h(t) 10 z(t) 2 -10 Figure 3 Find y(t)-h(t)sz(t) using the graphical approach of the convolution integral (by hand). You can use MATLAB...
 3. This is an exercise about convolution. Consider the signals f and g below, both periodic with T -2. t sin(2t), -1-t 〈 0; (1+1), It _ 0.51, 一1 〈 t 〈 0; 0
 Problem 4 Given: St t(t) # -t e g(t) a) Compute fg () using convolution integral method. b) Compute g*f () with Laplace transform. o) What are the differences between the results of questions (a) and (0) above? d) Find the Laplace transform of the following function: (t 0 to +oo) e dt e) Find the equivalent solution of (d) using MATLAB method) (find 2 methods)
Problem 4 Given: St t(t) # -t e g(t) a) Compute fg () using...
Problem 4 Given: St t(t) # -t e g(t) a) Compute fg () using convolution integral method. b) Compute g*f () with Laplace transform. o) What are the differences between the results of questions (a) and (0) above? d) Find the Laplace transform of the following function: (t 0 to +oo) e dt e) Find the equivalent solution of (d) using MATLAB method) (find 2 methods)
Problem 4 Given: St t(t) # -t e g(t) a) Compute fg () using...
 Compute the convolution using the CONVOLUTIONAL SUM
method
Problem 2.19. Compute the convolution y(n) of the signals -3< < 1 (n) = Ja". 0 . Otherwise hin) = w Si, 0<n<4 0 otherwise where a is a given parameter.
Compute the convolution using the CONVOLUTIONAL SUM
method
Problem 2.19. Compute the convolution y(n) of the signals -3< < 1 (n) = Ja". 0 . Otherwise hin) = w Si, 0<n<4 0 otherwise where a is a given parameter.
 Find the convolution integral of the following figure pairs: use
the graph method
y(t) X(t) 0 1 2 3 4
Find the convolution integral of the following figure pairs: use
the graph method
y(t) X(t) 0 1 2 3 4
 Help please!
Problem No. P1: Convolution Below is a Matlab code for performing convolution of two sequences. function [y,ny] conv m(x,nx,h,nh) % Modified convolution routine for signal processing [y,ny] convolution result x,nx] first signal Dh,nh] second signal nyb nx(1)+nh(1); nye nx(length(x)) y-conv (x,h); Use the code to perform convolution of r) 1.2,3,4 and h( 3.2,1 nh (length(h));
Help please!
Problem No. P1: Convolution Below is a Matlab code for performing convolution of two sequences. function [y,ny] conv m(x,nx,h,nh) % Modified convolution routine for signal processing [y,ny] convolution result x,nx] first signal Dh,nh] second signal nyb nx(1)+nh(1); nye nx(length(x)) y-conv (x,h); Use the code to perform convolution of r) 1.2,3,4 and h( 3.2,1 nh (length(h));
Most questions answered within 3 hours.
-
The historical returns on a balanced portfolio have had an
average return of 11% and a...
asked 3 seconds from now -
Sulfuric acid (250.0mL) is titrated with 176.5 mL 2.4 M NaOH to
an equivalence point (the...
asked 11 minutes ago -
The quality control manager of a cookie company is inspecting a
batch of chocolate-chip cookies that...
asked 13 minutes ago -
How can we identify what the horizontal force is when looking at
a merry go round?...
asked 45 minutes ago -
While Dime Community Bank is based in Brooklyn; management has
decided to focus its lending activity...
asked 1 hour ago -
1) Earnings functions, whereby the log of earnings is regressed
on years of education, years of...
asked 44 minutes ago -
Bruno Corporation is involved in the business of injection
molding of plastics. It is considering the...
asked 49 minutes ago -
What would be the vapor pressure of water at 96°C above a
solution made by dissolving...
asked 1 hour ago -
Hydration of norbornene
Write the reaction. Discuss the intermediate. Explain how the
equilibrium in the reaction...
asked 1 hour ago -
Suppose that a party wanted to enter an FRA that expires in 42
days and is...
asked 1 hour ago -
ABC Ltd. estimated that a new store requires an initial
investment of $800,000. This new store...
asked 1 hour ago -
1. Review the Nike’s marketing strategy. You must include the
company’s target market, possible market segmentation,...
asked 1 hour ago