
3. a) How do the ratios you calculated for this year compare to those of the typical company in the industry?
b) Describe and explain the areas that could cause the company problems in the future.
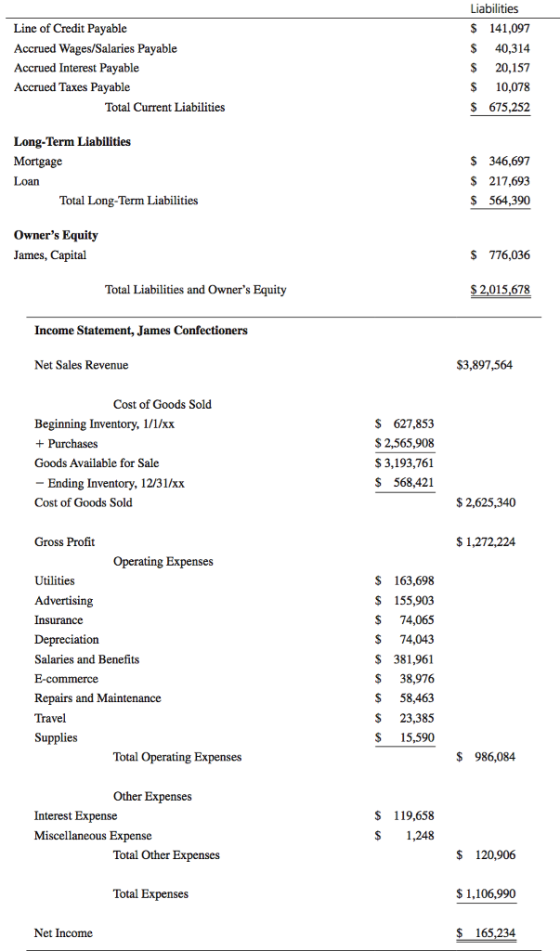
Homework Answers
RATIO James Percent
Confectioners Confectionary Variation
Current Last Industry from
Year Year Mean* Ind. Mean
Liquidity Ratios
Current Ratio 2.01 1.86 1.7 18.0%
Quick Ratio 1.16 1.07 0.8 45.5%
Leverage Ratios
Debt Ratio 0.62 0.64 0.7 -11.5%
Debt-to-Net Worth Ratio 1.60 1.71 1.7 -6.0%
Times Interest Earned Ratio 2.38 2.49 2.3 3.5%
Operating Ratios
Average Inventory Turnover Ratio 4.39 4.75 4.9 -10.4%
Average Collection Period Ratio 47.6 34.6 23.0 days 107.2%
Average Payable Period Ratio 34.4 31.3 33.5 days 2.8%
Net Sales to Total Assets Ratio 1.93 2.17 2.1 -7.9%
Profitability Ratios
Net Profit on Sales Ratio 4.24% 7.40% 7.0% -39.4%
Net Profit to Assets Ratio 8.20% 9.20% 5.6% 46.4%
Net Profit to Equity Ratio 21.29% 29.21% 16.5% 29.0%
One of the most significant concerns is in the average collection period. James Confectioners is waiting more than three weeks longer than the industry average for payment. This is taking a serious toll on cash flow and may result in increasing the chances for uncollectible debt. This limited cash flow threatens the viability of the business.
Add Answer to:
3. a) How do the ratios you calculated for this year
compare to those of the...
2. a) How do the ratios that you calculated for this year compare to those that...
 2. a) How do the ratios that you calculated for this
year compare to those that Ivey calculated for the company last
year?
b) What factors from the case are most likely to account
for those changes?
Ratio
Current Year
Last Year
Percent Variation
Liquidity Ratios
Current ratio
2.01
1.86
8.1%
Quick ratio
1.07
Leverage Ratios
Debt ratio
0.64
Debt-to-Net-Worth ratio
1.71
Times-Interest-Earned ratio
2.49
Operating Ratios
Average Inventory Turnover Ratio
4.75
Average Collection Period Ratio
34.60
Average Payable Period...
2. a) How do the ratios that you calculated for this
year compare to those that Ivey calculated for the company last
year?
b) What factors from the case are most likely to account
for those changes?
Ratio
Current Year
Last Year
Percent Variation
Liquidity Ratios
Current ratio
2.01
1.86
8.1%
Quick ratio
1.07
Leverage Ratios
Debt ratio
0.64
Debt-to-Net-Worth ratio
1.71
Times-Interest-Earned ratio
2.49
Operating Ratios
Average Inventory Turnover Ratio
4.75
Average Collection Period Ratio
34.60
Average Payable Period...
4. Develop a set of specific recommendations for improving the financial performance of James Confectioners using...
 4. Develop a set of specific recommendations
for improving the financial performance of James Confectioners
using the analysis you conducted in questions 1 to 3.
5. What pricing recommendations and
rationale can you make to James Confectioners?
James Confectioners—Part 1 Squeezed by Rising Costs, a Confectioner about the impact of the rapidly rising cost of the base choco- Struggles to Cope late, however. Bad weather in South America and Africa, where most of the world's cocoa is grown, and a...
4. Develop a set of specific recommendations
for improving the financial performance of James Confectioners
using the analysis you conducted in questions 1 to 3.
5. What pricing recommendations and
rationale can you make to James Confectioners?
James Confectioners—Part 1 Squeezed by Rising Costs, a Confectioner about the impact of the rapidly rising cost of the base choco- Struggles to Cope late, however. Bad weather in South America and Africa, where most of the world's cocoa is grown, and a...
1. Calculate the 12 ratios for Bluffton pharmacy for this year. 2. How do the ratios...
 1. Calculate the 12 ratios for Bluffton pharmacy for this
year.
2. How do the ratios you calculated for this year compare to
those for the pharmacy last year?
Case 6 Bluffton Pharmacy wo New Pharmacy Owners Learn valuable Lessons About Financial statements and Analysis has been a little more than two years since Angela Craw- and and Martin Rodriguez purchased the Bluffton Pharmacy from Frank White, the previous owner and founder, who had started the pharmacy in 1969. The...
1. Calculate the 12 ratios for Bluffton pharmacy for this
year.
2. How do the ratios you calculated for this year compare to
those for the pharmacy last year?
Case 6 Bluffton Pharmacy wo New Pharmacy Owners Learn valuable Lessons About Financial statements and Analysis has been a little more than two years since Angela Craw- and and Martin Rodriguez purchased the Bluffton Pharmacy from Frank White, the previous owner and founder, who had started the pharmacy in 1969. The...
How do you perform a Du Point analysis given average ratios. This question comes from 17.4...
 How do you perform a Du Point analysis given average ratios.
This question comes from 17.4 of the book. Healthcare finance how
do I get started
17.4 Consider the following financial statements for BestCare HMPO, a not-for-profit managed care plan: BestCare HMO Statement of Operations and Change in Net Assets, Year Ended June 30, 2015 in thousands) Revenue: Premiums earned $26,682 Coinsurance 1,689 Interest and other income 242 Total revenues $28,613 Expenses: Salaries and benefits $15,154 Medical supplies and drugs...
How do you perform a Du Point analysis given average ratios.
This question comes from 17.4 of the book. Healthcare finance how
do I get started
17.4 Consider the following financial statements for BestCare HMPO, a not-for-profit managed care plan: BestCare HMO Statement of Operations and Change in Net Assets, Year Ended June 30, 2015 in thousands) Revenue: Premiums earned $26,682 Coinsurance 1,689 Interest and other income 242 Total revenues $28,613 Expenses: Salaries and benefits $15,154 Medical supplies and drugs...
How do I solve for b? data presented in esented in the core valid for both...
 How do I solve for b?
data presented in esented in the core valid for both 2014 and 2015. the following financial statements for BestCare HMO, a 174 Consider the for profit managed care plan Care HMO Statement of Operations and Change in Not Aucts, Year Ended June 30, 2015 in thousands $26,682 1.689 242 $28,613 Revenue Premiums earned Coinsurance Interest and other income Total revenues Expenses Salaries and benefits Medical supplies and drugs Insurance Provision for bad debts Depreciation...
How do I solve for b?
data presented in esented in the core valid for both 2014 and 2015. the following financial statements for BestCare HMO, a 174 Consider the for profit managed care plan Care HMO Statement of Operations and Change in Not Aucts, Year Ended June 30, 2015 in thousands $26,682 1.689 242 $28,613 Revenue Premiums earned Coinsurance Interest and other income Total revenues Expenses Salaries and benefits Medical supplies and drugs Insurance Provision for bad debts Depreciation...
QUESTION 3 From following financial statements, calculate following ratios and analyse the current year and previous...
 QUESTION 3 From following financial statements, calculate following ratios and analyse the current year and previous year performance a) Current ratio. b) Days sales outstanding (DSO). (Sales 2017 RM500m & Sales 2018 RM600m) c) Inventory turnover ratio d) Total debt to assets e) Return on assets (ROA) (Net income 2017 RM42m &Net income 2018 RM58m) Moon Inc. Balance Sheet (RM millions) as at December 31, 2015 and 2016 2015 21 51 2016 20 84 Cash Accounts receivable Inventory Prepaid expenses...
Can someone help!? I do not understand how to create a ProForma income statement or balance staement for 2018?
The company is planning to open another location in 2018. Using the Preliminary Statements as a base, prepare pro forma (budgeted) financials for 2018 for the new location using the following information: Cost of leasing commercial space: $1,500 per month.Cost of new equipment: $15,000, purchased with a long-term note. Use straight line depreciation assuming a seven-year life, no residual value. Use full year’s depreciation for the first year. Equipment purchase was financed with a long-term note.Cost of...
Ratios Analysis: Hershey The Hershey Company is one of the world's leading producers of chocolates, candies,...
Ratios Analysis: Hershey The Hershey Company is one of the world's leading producers of chocolates, candies, and confections. It sells chocolates and candies, mints and gums, baking ingredients, toppings, and beverages. Hershey's consolidated balance sheets for 2012 and 2013 follow. Hershey: Consolidated Balance Sheets Dollar Amounts in Millions 2012 2013 Assets Current Assets Cash and Equivalents $ 728.3 $ 1,118.5 Receivables 461.4 477.9 Inventories 633.3 659.5 Deferred Income Taxes 122.2 52.5 Prepaid Expenses and Other Assets 168.3 178.9 Total Current...
QUESTION 5 Next year, JuliJuli Sdn Bhd is planning for a major sales increase of 40%....
 QUESTION 5 Next year, JuliJuli Sdn Bhd is planning for a major sales increase of 40%. Sales are currently RM30,000,000 and it is forecast that next year's sales will be RM42,000,000. Current assets are expected to increase in direct proportion with increase in sales. Similarly, account payable and accrued expenses are also expected proportionately es per the increase in sales. Fixed assets on the other hand will increase by RM1,000,000; and long term debt expected to remain constant. The net...
Problem 12-4B Calculate risk ratios (L012-3) The following income statement and balance sheets for The Athletic...
 Problem 12-4B Calculate risk ratios (L012-3) The following income statement and balance sheets for The Athletic Attic are provided. THE ATHLETIC ATTIC Income Statement For the year ended December 31, 2021 Net sales $8,780,000 Cost of goods sold 5,390,000 Gross profit 3,390,000 Expenses: Operating expenses $1,540,000 Depreciation expense 198.000 Interest expense 38. Bee Income tax expense 348,000 Total expenses 2,124,000 Net income 31.266,000 THE ATHLETIC ATTIC Balance Sheets December 31 2021 2020 Assets Current assets: $ $ 152,000 730,000 1,345,000...
 2. a) How do the ratios that you calculated for this
year compare to those that Ivey calculated for the company last
year?
b) What factors from the case are most likely to account
for those changes?
Ratio
Current Year
Last Year
Percent Variation
Liquidity Ratios
Current ratio
2.01
1.86
8.1%
Quick ratio
1.07
Leverage Ratios
Debt ratio
0.64
Debt-to-Net-Worth ratio
1.71
Times-Interest-Earned ratio
2.49
Operating Ratios
Average Inventory Turnover Ratio
4.75
Average Collection Period Ratio
34.60
Average Payable Period...
2. a) How do the ratios that you calculated for this
year compare to those that Ivey calculated for the company last
year?
b) What factors from the case are most likely to account
for those changes?
Ratio
Current Year
Last Year
Percent Variation
Liquidity Ratios
Current ratio
2.01
1.86
8.1%
Quick ratio
1.07
Leverage Ratios
Debt ratio
0.64
Debt-to-Net-Worth ratio
1.71
Times-Interest-Earned ratio
2.49
Operating Ratios
Average Inventory Turnover Ratio
4.75
Average Collection Period Ratio
34.60
Average Payable Period...
 4. Develop a set of specific recommendations
for improving the financial performance of James Confectioners
using the analysis you conducted in questions 1 to 3.
5. What pricing recommendations and
rationale can you make to James Confectioners?
James Confectioners—Part 1 Squeezed by Rising Costs, a Confectioner about the impact of the rapidly rising cost of the base choco- Struggles to Cope late, however. Bad weather in South America and Africa, where most of the world's cocoa is grown, and a...
4. Develop a set of specific recommendations
for improving the financial performance of James Confectioners
using the analysis you conducted in questions 1 to 3.
5. What pricing recommendations and
rationale can you make to James Confectioners?
James Confectioners—Part 1 Squeezed by Rising Costs, a Confectioner about the impact of the rapidly rising cost of the base choco- Struggles to Cope late, however. Bad weather in South America and Africa, where most of the world's cocoa is grown, and a...
 1. Calculate the 12 ratios for Bluffton pharmacy for this
year.
2. How do the ratios you calculated for this year compare to
those for the pharmacy last year?
Case 6 Bluffton Pharmacy wo New Pharmacy Owners Learn valuable Lessons About Financial statements and Analysis has been a little more than two years since Angela Craw- and and Martin Rodriguez purchased the Bluffton Pharmacy from Frank White, the previous owner and founder, who had started the pharmacy in 1969. The...
1. Calculate the 12 ratios for Bluffton pharmacy for this
year.
2. How do the ratios you calculated for this year compare to
those for the pharmacy last year?
Case 6 Bluffton Pharmacy wo New Pharmacy Owners Learn valuable Lessons About Financial statements and Analysis has been a little more than two years since Angela Craw- and and Martin Rodriguez purchased the Bluffton Pharmacy from Frank White, the previous owner and founder, who had started the pharmacy in 1969. The...
 How do you perform a Du Point analysis given average ratios.
This question comes from 17.4 of the book. Healthcare finance how
do I get started
17.4 Consider the following financial statements for BestCare HMPO, a not-for-profit managed care plan: BestCare HMO Statement of Operations and Change in Net Assets, Year Ended June 30, 2015 in thousands) Revenue: Premiums earned $26,682 Coinsurance 1,689 Interest and other income 242 Total revenues $28,613 Expenses: Salaries and benefits $15,154 Medical supplies and drugs...
How do you perform a Du Point analysis given average ratios.
This question comes from 17.4 of the book. Healthcare finance how
do I get started
17.4 Consider the following financial statements for BestCare HMPO, a not-for-profit managed care plan: BestCare HMO Statement of Operations and Change in Net Assets, Year Ended June 30, 2015 in thousands) Revenue: Premiums earned $26,682 Coinsurance 1,689 Interest and other income 242 Total revenues $28,613 Expenses: Salaries and benefits $15,154 Medical supplies and drugs...
 How do I solve for b?
data presented in esented in the core valid for both 2014 and 2015. the following financial statements for BestCare HMO, a 174 Consider the for profit managed care plan Care HMO Statement of Operations and Change in Not Aucts, Year Ended June 30, 2015 in thousands $26,682 1.689 242 $28,613 Revenue Premiums earned Coinsurance Interest and other income Total revenues Expenses Salaries and benefits Medical supplies and drugs Insurance Provision for bad debts Depreciation...
How do I solve for b?
data presented in esented in the core valid for both 2014 and 2015. the following financial statements for BestCare HMO, a 174 Consider the for profit managed care plan Care HMO Statement of Operations and Change in Not Aucts, Year Ended June 30, 2015 in thousands $26,682 1.689 242 $28,613 Revenue Premiums earned Coinsurance Interest and other income Total revenues Expenses Salaries and benefits Medical supplies and drugs Insurance Provision for bad debts Depreciation...
 QUESTION 3 From following financial statements, calculate following ratios and analyse the current year and previous year performance a) Current ratio. b) Days sales outstanding (DSO). (Sales 2017 RM500m & Sales 2018 RM600m) c) Inventory turnover ratio d) Total debt to assets e) Return on assets (ROA) (Net income 2017 RM42m &Net income 2018 RM58m) Moon Inc. Balance Sheet (RM millions) as at December 31, 2015 and 2016 2015 21 51 2016 20 84 Cash Accounts receivable Inventory Prepaid expenses...
 QUESTION 5 Next year, JuliJuli Sdn Bhd is planning for a major sales increase of 40%. Sales are currently RM30,000,000 and it is forecast that next year's sales will be RM42,000,000. Current assets are expected to increase in direct proportion with increase in sales. Similarly, account payable and accrued expenses are also expected proportionately es per the increase in sales. Fixed assets on the other hand will increase by RM1,000,000; and long term debt expected to remain constant. The net...
 Problem 12-4B Calculate risk ratios (L012-3) The following income statement and balance sheets for The Athletic Attic are provided. THE ATHLETIC ATTIC Income Statement For the year ended December 31, 2021 Net sales $8,780,000 Cost of goods sold 5,390,000 Gross profit 3,390,000 Expenses: Operating expenses $1,540,000 Depreciation expense 198.000 Interest expense 38. Bee Income tax expense 348,000 Total expenses 2,124,000 Net income 31.266,000 THE ATHLETIC ATTIC Balance Sheets December 31 2021 2020 Assets Current assets: $ $ 152,000 730,000 1,345,000...
Most questions answered within 3 hours.
-
The Williams have a stock they have held for over a year that
they believe is...
asked 50 minutes ago -
11.53g sample of NaBr contains 22.34% Na by mass Considering
the law of constant composition how...
asked 1 hour ago -
Exercise 5-22A Complete the accounting cycle using receivable
transactions (LO5–1, 5–2, 5–4, 5–5, 5–7) [The following...
asked 2 hours ago -
Do you agree with the view that small businesses are more
vulnerable to employee theft because...
asked 2 hours ago -
Four forces act on an object, given by A = 41.3 N east, B = 46.3...
asked 3 hours ago -
Which of the following design considerations leads to more
user-friendly presentation layers for GUIs? [Check all...
asked 4 hours ago -
38%
of adults say cashews are their favorite kind of nut. You
randomly select 12 adults...
asked 6 hours ago -
Notational Inc. is considering installing a new server. The
machine costs $100,000 and is expected to...
asked 6 hours ago -
Given the information coding of DNA strand:
5'-TTT-TAC-GAA-GAG-TGA-3',
Write the corresponding DNA template and mRNA strand...
asked 6 hours ago -
2. Boris recently synthesized an explosive compound he named
Badenoughium. The molecular formula for Bdenoughium is...
asked 10 hours ago -
5. A car decelerate evenly from a velocity of 50mph until rest
in a distance of...
asked 10 hours ago -
IN HTML Programming
1. Write a script that inputs integers (one at a time) and
passes...
asked 10 hours ago