
Homework Answers
(a) The frequency table is:
| cumulative | ||||||||
| lower | upper | midpoint | width | frequency | percent | frequency | percent | |
| 30 | < | 39.99 | 35 | 10 | 2 | 5.0 | 2 | 5.0 |
| 40 | < | 49.99 | 45 | 10 | 4 | 10.0 | 6 | 15.0 |
| 50 | < | 59.99 | 55 | 10 | 8 | 20.0 | 14 | 35.0 |
| 60 | < | 69.99 | 65 | 10 | 11 | 27.5 | 25 | 62.5 |
| 70 | < | 79.99 | 75 | 10 | 8 | 20.0 | 33 | 82.5 |
| 80 | < | 89.99 | 85 | 10 | 5 | 12.5 | 38 | 95.0 |
| 90 | < | 99.99 | 95 | 10 | 2 | 5.0 | 40 | 100.0 |
| 40 | 100.0 |
The histogram is:
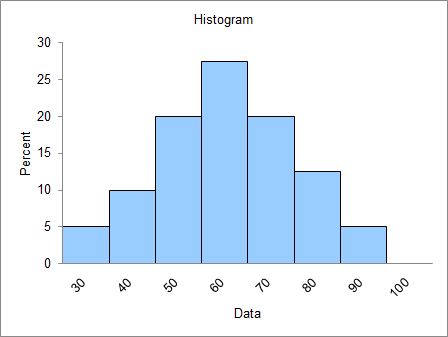
(b) The data is normally distributed.
Add Answer to:
81 Problem 4 (10 marks) The number of calls received per week by the clients services...
81 59 Problem 4 (10 marks) The number of calls received per week by the clients...
 81 59 Problem 4 (10 marks) The number of calls received per week by the clients services of a cell phone company over the last 40 weeks are given as follows: 63 74 42 65 51 54 36 56 68 57 62 64 76 67 79 61 77 38 84 68 71 94 71 86 69 75 91 55 48 82 83 54 79 62 68 58 41 47 a) Prepare a frequency distribution (table) and histogram for the data....
Problem 4 (10 marks) The number of calls received per week by the clients services of...
Problem 4 (10 marks) The number of calls received per week by the clients services of a cell phone company over the last 40 weeks are given as follows: 63 74 42 65 51 54 36 56 68 57 62 64 76 67 79 61 81 77 59 38 84 68 71 94 71 86 69 75 91 55 48 82 83 54 79 62 68 58 41 47 a) Prepare a frequency distribution (table) and histogram for the data....
The number of calls received per week by the clients services of a cell phone company...
The number of calls received per week by the clients services of a cell phone company over the last 40 weeks are given as follows: 63 74 42 65 51 54 36 56 68 57 62 64 76 67 79 61 81 77 59 38 84 68 71 94 71 86 69 75 91 55 48 82 83 54 79 62 68 58 41 47 a) Prepare a frequency distribution (table) and histogram for the data. Specify the number of...
63 56 68 Problem 4 (10 marks) The number of calls received per week by the...
 63 56 68 Problem 4 (10 marks) The number of calls received per week by the clients services of a cell phone company over the last 40 weeks are given as follows: 74 42 65 51 54 36 57 62 64 76 67 79 61 81 77 59 38 84 71 94 86 69 75 91 55 82 79 68 58 41 47 a) Prepare a frequency distribution (table) and histogram for the data. Specify the number of bins, the...
Im having a hard time with this question please explain solution properly Problem 4 (10 marks)...
 Im having a hard time with this question please explain
solution properly
Problem 4 (10 marks) The number of calls received per week by the clients services of a cell phone company over the last 40 weeks are given as follows: 63 74 42 65 51 54 36 56 68 57 62 64 76 67 79 61 81 77 59 38 84 68 71 71 86 69 75 91 55 48 82 83 54 79 62 68 58 41 a)...
Im having a hard time with this question please explain
solution properly
Problem 4 (10 marks) The number of calls received per week by the clients services of a cell phone company over the last 40 weeks are given as follows: 63 74 42 65 51 54 36 56 68 57 62 64 76 67 79 61 81 77 59 38 84 68 71 71 86 69 75 91 55 48 82 83 54 79 62 68 58 41 a)...
Consider the below matrixA, which you can copy and paste directly into Matlab.
Problem #1: Consider the below matrix A, which you can copy and paste directly into Matlab. The matrix contains 3 columns. The first column consists of Test #1 marks, the second column is Test # 2 marks, and the third column is final exam marks for a large linear algebra course. Each row represents a particular student.A = [36 45 75 81 59 73 77 73 73 65 72 78 65 55 83 73 57 78 84 31 60 83...
Use the accompanying data set on the pulse rates (in beats per minute) of males to...
Use the accompanying data set on the pulse rates (in beats per minute) of males to complete parts (a) and (b) below. LOADING... Click the icon to view the pulse rates of males. a. Find the mean and standard deviation, and verify that the pulse rates have a distribution that is roughly normal. The mean of the pulse rates is 71.871.8 beats per minute. (Round to one decimal place as needed.) The standard deviation of the pulse rates is 12.212.2...
1. Forecast demand for Year 4. a. Explain what technique you utilized to forecast your demand....
 1. Forecast demand for Year 4.
a. Explain what technique you utilized to forecast your
demand.
b. Explain why you chose this technique over others.
Year 3 Year 1 Year 2 Actual Actual Actual Forecast Forecast Forecast Demand Demand Demand Week 1 52 57 63 55 66 77 Week 2 49 58 68 69 75 65 Week 3 47 50 58 65 80 74 Week 4 60 53 58 55 78 67 57 Week 5 49 57 64 76 77...
1. Forecast demand for Year 4.
a. Explain what technique you utilized to forecast your
demand.
b. Explain why you chose this technique over others.
Year 3 Year 1 Year 2 Actual Actual Actual Forecast Forecast Forecast Demand Demand Demand Week 1 52 57 63 55 66 77 Week 2 49 58 68 69 75 65 Week 3 47 50 58 65 80 74 Week 4 60 53 58 55 78 67 57 Week 5 49 57 64 76 77...
Use this set of 40 exam scores as the POPULATION for this activity: (put them into...
Use this set of 40 exam scores as the POPULATION for this activity: (put them into List 1 in your calculator) 67 90 74 66 76 79 77 53 86 86 68 81 72 57 79 78 50 66 77 66 81 79 80 73 71 56 81 86 62 69 81 78 77 80 88 62 67 62 74 94 Use this set of 40 exam scores as the POPULATION for this activity: (put them into List 1 in...
Use the Grouped Distribution method for the following exercise (see Self-Test 2-4 for detailed instructions), rounding...
Use the Grouped Distribution method for the following exercise (see Self-Test 2-4 for detailed instructions), rounding each answer to the nearest whole number. Using the frequency distribution below (scores on a statistics exam taken by 80 students), determine:ion 1 of the preliminary test (scores on a statistics exam taken by 80 students), determine: 68 84 75 82 68 90 62 88 76 93 73 79 88 73 60 93 71 59 85 75 61 65 75 87 74 62 95...
 81 59 Problem 4 (10 marks) The number of calls received per week by the clients services of a cell phone company over the last 40 weeks are given as follows: 63 74 42 65 51 54 36 56 68 57 62 64 76 67 79 61 77 38 84 68 71 94 71 86 69 75 91 55 48 82 83 54 79 62 68 58 41 47 a) Prepare a frequency distribution (table) and histogram for the data....
 63 56 68 Problem 4 (10 marks) The number of calls received per week by the clients services of a cell phone company over the last 40 weeks are given as follows: 74 42 65 51 54 36 57 62 64 76 67 79 61 81 77 59 38 84 71 94 86 69 75 91 55 82 79 68 58 41 47 a) Prepare a frequency distribution (table) and histogram for the data. Specify the number of bins, the...
 Im having a hard time with this question please explain
solution properly
Problem 4 (10 marks) The number of calls received per week by the clients services of a cell phone company over the last 40 weeks are given as follows: 63 74 42 65 51 54 36 56 68 57 62 64 76 67 79 61 81 77 59 38 84 68 71 71 86 69 75 91 55 48 82 83 54 79 62 68 58 41 a)...
Im having a hard time with this question please explain
solution properly
Problem 4 (10 marks) The number of calls received per week by the clients services of a cell phone company over the last 40 weeks are given as follows: 63 74 42 65 51 54 36 56 68 57 62 64 76 67 79 61 81 77 59 38 84 68 71 71 86 69 75 91 55 48 82 83 54 79 62 68 58 41 a)...
 1. Forecast demand for Year 4.
a. Explain what technique you utilized to forecast your
demand.
b. Explain why you chose this technique over others.
Year 3 Year 1 Year 2 Actual Actual Actual Forecast Forecast Forecast Demand Demand Demand Week 1 52 57 63 55 66 77 Week 2 49 58 68 69 75 65 Week 3 47 50 58 65 80 74 Week 4 60 53 58 55 78 67 57 Week 5 49 57 64 76 77...
1. Forecast demand for Year 4.
a. Explain what technique you utilized to forecast your
demand.
b. Explain why you chose this technique over others.
Year 3 Year 1 Year 2 Actual Actual Actual Forecast Forecast Forecast Demand Demand Demand Week 1 52 57 63 55 66 77 Week 2 49 58 68 69 75 65 Week 3 47 50 58 65 80 74 Week 4 60 53 58 55 78 67 57 Week 5 49 57 64 76 77...
Most questions answered within 3 hours.
-
Write a c/c++ program to read a list of students from a file and
create a...
asked 4 minutes ago -
Identify two different methods for collecting data in
qualitative research. What are the benefits and challenges...
asked 5 minutes ago -
I am suppose to have my array before the main class but I am
getting the...
asked 7 minutes ago -
Your task is to design the page table for the 32bit Pentium
microprocessor. Answer the following...
asked 13 minutes ago -
The Paradise Shoes Company has estimated its weekly TVC function
from data collected over the past...
asked 12 minutes ago -
A researcher wishes to study the cumulative effects of several
combinations of HIV drugs. There are...
asked 12 minutes ago -
Although Epicurus advocates pursuing pleasure for the
good life, discuss a few reasons why he does...
asked 29 minutes ago -
Problem 1: Present entries to record the selected transactions
described below:
(a)
Issued $2,790,000 of 5-year,...
asked 35 minutes ago -
Using technology to support HR activities increases:
a.
the efficiency of the administrative HR functions.
b....
asked 36 minutes ago -
1. List the features used to classify leaf
types.
2. List some characteristics that are shared...
asked 41 minutes ago -
The three elements of Value Proposition, Key Customers, and
Capabilities operate within an environment. Which of...
asked 44 minutes ago -
Katelynn, a physician, earns $200,000 from her medical practice
in the current year. She receives $45,000...
asked 51 minutes ago