


Homework Answers
a)
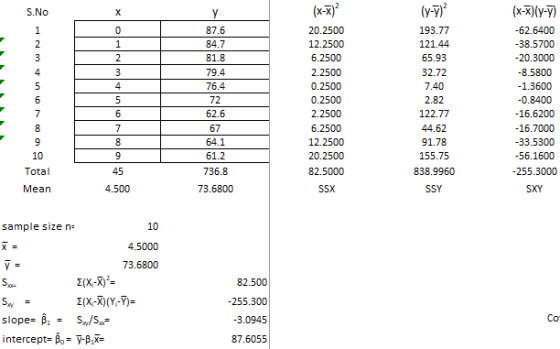
y^ = -3.095x+87.605
b)
for slope : option A is correct : blank is : 3.095
for intercept : option A is correct ":blank is :87.605
| predicted grade=87.605+5*-3.095= | 72.1 | |
residual =76.4-72.1 =4.3
Final grade is above average
Add Answer to:
The data below represent the number of days absent, x, and the final grade, y, for...
The data below represent the number of days absent, x, and the final grade, y, for...
The data below represent the number of days absent, x, and the final grade, y, for a sample of college students at a large university. Complete parts (a) through (e) below. No. of absences, x 0 1 2 3 4 5 6 7 8 9 Final grade, y 88.1 85.1 82.1 79.6 76.5 72.0 62.3 66.7 63.7 60.7 (a) Find the least-squares regression line treating the number of absences, x, as the explanatory variable and the final grade, y, as...
1 4 8 9 The data below represent the number of days absent, x, and the...
 1 4 8 9 The data below represent the number of days absent, x, and the final grade, y, for a sample of college students at a large university. Complete parts (a) th below. No. of absences, 0 2 3 5 6 7 Final grade, y 87.7 84.9 82.0 79.6 76.7 72.4 62.9 67.4 64.6 61.8 (a) Find the least-squares regression Line treating the number of absences, x, as the explanatory variable and the final grade, y, as the response...
Thus Question: 6 pts 2 of 30 (1 complete) This Qu The data below represent the...
 Thus Question: 6 pts 2 of 30 (1 complete) This Qu The data below represent the number of days absent, x, and the final grade, y, for a sample of college students at a large university Complete pe below. No. of absences, * 0 1 2 3 4 5 6 7 8 9 Final grade, y 88.1 852 822 796 76.6 72.1 62.5 66.9 63.9 60.9 (a) Find the least squares regression line treating the number of absences, x, as...
The data below represent the number of days absent, x, and the final grade, y, for...
 The data below represent the number of days absent, x, and the final grade, y, for a sample of college students at a large university. Complete parts (a) through (e) below No. of absences, x 0 1 2 3 4 5 6 7 8 9 Final grade, y 88.9 86.0 82.9 80.3 77.4 72.9 63.4 67.7 64.7 61.7 (a) Find the least-squares regression line treating the number of absences, x, as the explanatory variable and the final grade, y, as...
The accompanying data represent the number of days absent, x, and the final exam score, y,...
 The accompanying data represent the number of days absent, x, and the final exam score, y, for a sample of college students in a general education course at a large state university. Complete parts (a) through (e) below. B: Click the icon to view the absence count and final exam score data Click the icon to view a table of critical values for the correlation coefficient. (a) Find the least squares regression line treating number of absences as the explanatory...
The following data represents the number of days absent and the final grade for a sample...
 The following data represents the number of days absent and the final grade for a sample of college students in a general education course at a large state university. 0 1 2 3 4 5 6 7 8 9 No. of absences Final Grade 89.2 86.4 83.5 81.1 78.2 73.9 64.3 71.8 65.5 66.2 a) Which variable is the explanatory variable? b) Draw a scatter plot and describe your scatter plot (Direction, Strength, Form). c) Compute the correlation coefficient d)...
1. The following data represents the number of days absent and the final grade for a...
1. The following data represents the number of days absent and the final grade for a sample of college students in a general education course at a large state university. No. of absences 0 1 2 3 4 5 6 7 8 9 Final Grade 89.2 86.4 83.5 81.1 78.2 73.9 64.3 71.8 65.5 66.2 a) Which variable is the explanatory variable? b) Draw a scatter plot and describe your scatter plot (Direction, Strength, Form). c) Compute the correlation coefficient....
The accompanying data represent the number of daysabsent,x, and the final examscore,y, for a sample of...
 The accompanying data represent the number of daysabsent,x, and
the final examscore,y, for a sample of college students in a
general education course at a large state university.
a Find the east-squares regressiri Ine íreatng number cf absences as the explaratry vanable: and the final exam soare as th션 response: vanaue ㄇㄇ {Round to Ihre ! decimal places as "eeded.》 Absences and Final Exam Scores No. of absences,x 0 1 2 3 4 5ฉ789 Final cxam score. y l8.0 a8.7...
The accompanying data represent the number of daysabsent,x, and
the final examscore,y, for a sample of college students in a
general education course at a large state university.
a Find the east-squares regressiri Ine íreatng number cf absences as the explaratry vanable: and the final exam soare as th션 response: vanaue ㄇㄇ {Round to Ihre ! decimal places as "eeded.》 Absences and Final Exam Scores No. of absences,x 0 1 2 3 4 5ฉ789 Final cxam score. y l8.0 a8.7...
The accompanying data represent the number of days absent, x, and the final exam score, y,...
 The accompanying data represent the number of days absent, x, and the final exam score, y, for a sample of colege students in a general educanion course at a large state university Complete parts (a) through (e) below Click the icon to view the absence count and final exam score data Cick the icon to view a table of critical values for the comelation coefficient (a) Find the least-squares regression Iine treating number of absences as the explanatory variable and...
Run a regression analysis on the following data set, where y is the final grade in...
 Run a regression analysis on the following data set, where y is the final grade in a math class and x is the average number of hours the student spent working on math each week. hours/week Grade х у 4 41.6 4 54.6 8 68.2 8 73.2 8 66.2 11 63.4 11 70.4 11 80.4 13 71.2 16 85.4 State the regression equation y = mx + b, with constants accurate to two decimal places. What is the predicted value...
 1 4 8 9 The data below represent the number of days absent, x, and the final grade, y, for a sample of college students at a large university. Complete parts (a) th below. No. of absences, 0 2 3 5 6 7 Final grade, y 87.7 84.9 82.0 79.6 76.7 72.4 62.9 67.4 64.6 61.8 (a) Find the least-squares regression Line treating the number of absences, x, as the explanatory variable and the final grade, y, as the response...
 Thus Question: 6 pts 2 of 30 (1 complete) This Qu The data below represent the number of days absent, x, and the final grade, y, for a sample of college students at a large university Complete pe below. No. of absences, * 0 1 2 3 4 5 6 7 8 9 Final grade, y 88.1 852 822 796 76.6 72.1 62.5 66.9 63.9 60.9 (a) Find the least squares regression line treating the number of absences, x, as...
 The data below represent the number of days absent, x, and the final grade, y, for a sample of college students at a large university. Complete parts (a) through (e) below No. of absences, x 0 1 2 3 4 5 6 7 8 9 Final grade, y 88.9 86.0 82.9 80.3 77.4 72.9 63.4 67.7 64.7 61.7 (a) Find the least-squares regression line treating the number of absences, x, as the explanatory variable and the final grade, y, as...
 The accompanying data represent the number of days absent, x, and the final exam score, y, for a sample of college students in a general education course at a large state university. Complete parts (a) through (e) below. B: Click the icon to view the absence count and final exam score data Click the icon to view a table of critical values for the correlation coefficient. (a) Find the least squares regression line treating number of absences as the explanatory...
 The following data represents the number of days absent and the final grade for a sample of college students in a general education course at a large state university. 0 1 2 3 4 5 6 7 8 9 No. of absences Final Grade 89.2 86.4 83.5 81.1 78.2 73.9 64.3 71.8 65.5 66.2 a) Which variable is the explanatory variable? b) Draw a scatter plot and describe your scatter plot (Direction, Strength, Form). c) Compute the correlation coefficient d)...
 The accompanying data represent the number of daysabsent,x, and
the final examscore,y, for a sample of college students in a
general education course at a large state university.
a Find the east-squares regressiri Ine íreatng number cf absences as the explaratry vanable: and the final exam soare as th션 response: vanaue ㄇㄇ {Round to Ihre ! decimal places as "eeded.》 Absences and Final Exam Scores No. of absences,x 0 1 2 3 4 5ฉ789 Final cxam score. y l8.0 a8.7...
The accompanying data represent the number of daysabsent,x, and
the final examscore,y, for a sample of college students in a
general education course at a large state university.
a Find the east-squares regressiri Ine íreatng number cf absences as the explaratry vanable: and the final exam soare as th션 response: vanaue ㄇㄇ {Round to Ihre ! decimal places as "eeded.》 Absences and Final Exam Scores No. of absences,x 0 1 2 3 4 5ฉ789 Final cxam score. y l8.0 a8.7...
 The accompanying data represent the number of days absent, x, and the final exam score, y, for a sample of colege students in a general educanion course at a large state university Complete parts (a) through (e) below Click the icon to view the absence count and final exam score data Cick the icon to view a table of critical values for the comelation coefficient (a) Find the least-squares regression Iine treating number of absences as the explanatory variable and...
 Run a regression analysis on the following data set, where y is the final grade in a math class and x is the average number of hours the student spent working on math each week. hours/week Grade х у 4 41.6 4 54.6 8 68.2 8 73.2 8 66.2 11 63.4 11 70.4 11 80.4 13 71.2 16 85.4 State the regression equation y = mx + b, with constants accurate to two decimal places. What is the predicted value...
Most questions answered within 3 hours.
-
MATLAB HW 11 problem using Switch Case and Input commands
Write a script file that calculates...
asked 2 minutes ago -
A college student is employed as a door-to-door newspaper
salesman. Historical data suggests that the student...
asked 17 minutes ago -
Considering gravitational time dilation, calculate the time that
passes in Earth’s surface while 1 hour passes...
asked 41 minutes ago -
Minitab Problem: Take the Lake Hume June rainfall data and find
use the processes outlined in...
asked 1 hour ago -
X Company is trying to decide whether to continue using old
equipment to make Product A...
asked 1 hour ago -
IN PYTHON ONLY !! Program 2: Re-work
program #5 (WeeklyHours) from the previous assignment such that...
asked 2 hours ago -
The average length of time between arrivals at a turnpike
toll-booth is 26 seconds. What is...
asked 3 hours ago -
(a) A piston at 6.1 atm contains a gas that occupies a volume of
3.5 L....
asked 5 hours ago -
Please answer true or false. Words
cannot be changed or added in to make it true...
asked 5 hours ago -
An empty test tube weighs 15.923 grams. Then,
MgCl2•6H2O is added into the test tube. After...
asked 5 hours ago -
Assume memory access is 10 units of time and disk access is
10000 units of time....
asked 5 hours ago -
1. Are all good samples random?
2. Magazines often report surveys giving statistics such as “63%...
asked 5 hours ago