
Homework Answers
a)
here No of absences is explanatory variable and Final grade is dependent variable.
b)

direction is top left to bottom right.
two variables are negatively correlated.
c)

d)
assume significance level as 0.05

hence we cal conclude that there is a linear relation ship
between two variables because  is different than zero.
we are allowed to solve four sub parts only.
Add Answer to:
The following data represents the number of days absent and the final grade for a sample...
1. The following data represents the number of days absent and the final grade for a...
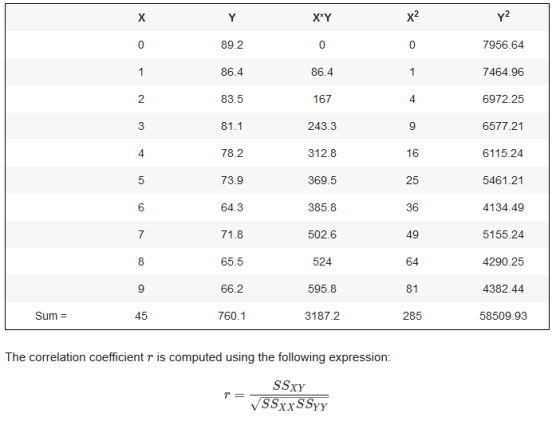
1. The following data represents the number of days absent and the final grade for a sample of college students in a general education course at a large state university. No. of absences 0 1 2 3 4 5 6 7 8 9 Final Grade 89.2 86.4 83.5 81.1 78.2 73.9 64.3 71.8 65.5 66.2 a) Which variable is the explanatory variable? b) Draw a scatter plot and describe your scatter plot (Direction, Strength, Form). c) Compute the correlation coefficient....
The data below represent the number of days absent, x, and the final grade, y, for...
The data below represent the number of days absent, x, and the final grade, y, for a sample of college students at a large university. Complete parts (a) through (e) below. No. of absences, x 0 1 2 3 4 5 6 7 8 9 Final grade, y 88.1 85.1 82.1 79.6 76.5 72.0 62.3 66.7 63.7 60.7 (a) Find the least-squares regression line treating the number of absences, x, as the explanatory variable and the final grade, y, as...
The data below represent the number of days absent, x, and the final grade, y, for...
 The data below represent the number of days absent, x, and the final grade, y, for a sample of college students at a large university. Complete parts (a) through (e) below. No. of absences, x 0 1 2 3 4 5 6 7 8 9 Final grade, y 87.6 84.7 81.8 79.4 76.4 72.0 62.6 670 64.1 61.2 (a) Find the least squares regression line treating the number of absences, x, as the explanatory variable and the final grade, y,...
The data below represent the number of days absent, x, and the final grade, y, for...
 The data below represent the number of days absent, x, and the final grade, y, for a sample of college students at a large university. Complete parts (a) through (e) below No. of absences, x 0 1 2 3 4 5 6 7 8 9 Final grade, y 88.9 86.0 82.9 80.3 77.4 72.9 63.4 67.7 64.7 61.7 (a) Find the least-squares regression line treating the number of absences, x, as the explanatory variable and the final grade, y, as...
Place your answers in the lines as indicated. The following data represents the number of days...
Place your answers in the lines as indicated. The following data represents the number of days absent, X, and the final grade, Y, for a sample of college students in a general education course at a large university. Absences X 1 2 3 4 5 6 Find grade 89 87 84 81 77 75 66 Find the correlation coefficient…………………………………………………... Find the regression equation……………………………………………………… Predict the final grade of a student who has 7 absences
1 4 8 9 The data below represent the number of days absent, x, and the...
 1 4 8 9 The data below represent the number of days absent, x, and the final grade, y, for a sample of college students at a large university. Complete parts (a) th below. No. of absences, 0 2 3 5 6 7 Final grade, y 87.7 84.9 82.0 79.6 76.7 72.4 62.9 67.4 64.6 61.8 (a) Find the least-squares regression Line treating the number of absences, x, as the explanatory variable and the final grade, y, as the response...
The accompanying data represent the number of days absent, x, and the final exam score, y,...
 The accompanying data represent the number of days absent, x, and the final exam score, y, for a sample of college students in a general education course at a large state university. Complete parts (a) through (e) below. B: Click the icon to view the absence count and final exam score data Click the icon to view a table of critical values for the correlation coefficient. (a) Find the least squares regression line treating number of absences as the explanatory...
The accompanying data represent the number of daysabsent,x, and the final examscore,y, for a sample of...
 The accompanying data represent the number of daysabsent,x, and
the final examscore,y, for a sample of college students in a
general education course at a large state university.
a Find the east-squares regressiri Ine íreatng number cf absences as the explaratry vanable: and the final exam soare as th션 response: vanaue ㄇㄇ {Round to Ihre ! decimal places as "eeded.》 Absences and Final Exam Scores No. of absences,x 0 1 2 3 4 5ฉ789 Final cxam score. y l8.0 a8.7...
The accompanying data represent the number of daysabsent,x, and
the final examscore,y, for a sample of college students in a
general education course at a large state university.
a Find the east-squares regressiri Ine íreatng number cf absences as the explaratry vanable: and the final exam soare as th션 response: vanaue ㄇㄇ {Round to Ihre ! decimal places as "eeded.》 Absences and Final Exam Scores No. of absences,x 0 1 2 3 4 5ฉ789 Final cxam score. y l8.0 a8.7...
The accompanying data represent the number of days absent, x, and the final exam score, y,...
 The accompanying data represent the number of days absent, x, and the final exam score, y, for a sample of colege students in a general educanion course at a large state university Complete parts (a) through (e) below Click the icon to view the absence count and final exam score data Cick the icon to view a table of critical values for the comelation coefficient (a) Find the least-squares regression Iine treating number of absences as the explanatory variable and...
Run a regression analysis on the following data set, where y is the final grade in...
 Run a regression analysis on the following data set, where y is the final grade in a math class and x is the average number of hours the student spent working on math each week. hours/week Grade х у 4 41.6 4 54.6 8 68.2 8 73.2 8 66.2 11 63.4 11 70.4 11 80.4 13 71.2 16 85.4 State the regression equation y = mx + b, with constants accurate to two decimal places. What is the predicted value...
 The data below represent the number of days absent, x, and the final grade, y, for a sample of college students at a large university. Complete parts (a) through (e) below. No. of absences, x 0 1 2 3 4 5 6 7 8 9 Final grade, y 87.6 84.7 81.8 79.4 76.4 72.0 62.6 670 64.1 61.2 (a) Find the least squares regression line treating the number of absences, x, as the explanatory variable and the final grade, y,...
 The data below represent the number of days absent, x, and the final grade, y, for a sample of college students at a large university. Complete parts (a) through (e) below No. of absences, x 0 1 2 3 4 5 6 7 8 9 Final grade, y 88.9 86.0 82.9 80.3 77.4 72.9 63.4 67.7 64.7 61.7 (a) Find the least-squares regression line treating the number of absences, x, as the explanatory variable and the final grade, y, as...
 1 4 8 9 The data below represent the number of days absent, x, and the final grade, y, for a sample of college students at a large university. Complete parts (a) th below. No. of absences, 0 2 3 5 6 7 Final grade, y 87.7 84.9 82.0 79.6 76.7 72.4 62.9 67.4 64.6 61.8 (a) Find the least-squares regression Line treating the number of absences, x, as the explanatory variable and the final grade, y, as the response...
 The accompanying data represent the number of days absent, x, and the final exam score, y, for a sample of college students in a general education course at a large state university. Complete parts (a) through (e) below. B: Click the icon to view the absence count and final exam score data Click the icon to view a table of critical values for the correlation coefficient. (a) Find the least squares regression line treating number of absences as the explanatory...
 The accompanying data represent the number of daysabsent,x, and
the final examscore,y, for a sample of college students in a
general education course at a large state university.
a Find the east-squares regressiri Ine íreatng number cf absences as the explaratry vanable: and the final exam soare as th션 response: vanaue ㄇㄇ {Round to Ihre ! decimal places as "eeded.》 Absences and Final Exam Scores No. of absences,x 0 1 2 3 4 5ฉ789 Final cxam score. y l8.0 a8.7...
The accompanying data represent the number of daysabsent,x, and
the final examscore,y, for a sample of college students in a
general education course at a large state university.
a Find the east-squares regressiri Ine íreatng number cf absences as the explaratry vanable: and the final exam soare as th션 response: vanaue ㄇㄇ {Round to Ihre ! decimal places as "eeded.》 Absences and Final Exam Scores No. of absences,x 0 1 2 3 4 5ฉ789 Final cxam score. y l8.0 a8.7...
 The accompanying data represent the number of days absent, x, and the final exam score, y, for a sample of colege students in a general educanion course at a large state university Complete parts (a) through (e) below Click the icon to view the absence count and final exam score data Cick the icon to view a table of critical values for the comelation coefficient (a) Find the least-squares regression Iine treating number of absences as the explanatory variable and...
 Run a regression analysis on the following data set, where y is the final grade in a math class and x is the average number of hours the student spent working on math each week. hours/week Grade х у 4 41.6 4 54.6 8 68.2 8 73.2 8 66.2 11 63.4 11 70.4 11 80.4 13 71.2 16 85.4 State the regression equation y = mx + b, with constants accurate to two decimal places. What is the predicted value...
Most questions answered within 3 hours.
-
4. How many input & output Key Value Pairs are passed into,
and emitted out of...
asked 23 minutes ago -
B. If compound Y has approximately the same values of solubility
in toluene as compound X,...
asked 12 minutes ago -
Oscar Inc. has inventory in Japan valued at 39,051,000 Yen one
year ago. One year ago...
asked 19 minutes ago -
If Canada suffered from "fundamental disequilibrium," and its
government choose not to devalue its currency, a...
asked 27 minutes ago -
Why would your heart not function well if constructed of
skeletal muscle? What is the particular...
asked 31 minutes ago -
Please respond to this essay question in full essay form for
Chemistry 1102 Organic and Biochemistry:...
asked 31 minutes ago -
Determine the head loss and velocity of flow in a water supply main
of 15.0 cm...
asked 34 minutes ago -
A marketing executive who knowingly authorizes a shoddy
defective product to be brought to market is...
asked 42 minutes ago -
Write a psudocode:
1. Define a function called authorize that takes in 2 strings,
uName, and...
asked 47 minutes ago -
What Hall voltage (in mV) is produced by a 0.180 T field applied
across a 2.60...
asked 46 minutes ago -
What mass of ethylene glycol (C2H6O2) must be added to 211.0 g
of water to obtain...
asked 49 minutes ago -
Mary's employer has a defined benefits retirement plan, which
pay 3.2% of her last year's salary...
asked 52 minutes ago