
Homework Answers
Let me know in the comment section if anything is not
clear. I will reply ASAP!
If you like the answer, please give a thumbs-up. This will be quite encouraging for me.Thank-you!
Add Answer to:
Short Answer Question We have m = 5 preliminary samples of size n-3 (some numbers have...
Short Answer Question We have m = 5 preliminary samples of size n = 3 (some...
 Short Answer Question We have m = 5 preliminary samples of size n = 3 (some numbers have unfortunately been erased by accident by a dumsy co-op student): 8 1 27.1 294 27.9 1.3 2 30.6 32.5 324 31.83 1.9 1.07 3 25.7 35.5 30 30.4 4.91 4 31.123.2 25 26.43 7.9 5 24.1 34.2 27.4 28.57 10.1 5.15 total: 145.13 32 16.57 What is the control chart (give the interval) for X from S?
Short Answer Question We have m = 5 preliminary samples of size n 3 (some numbers...
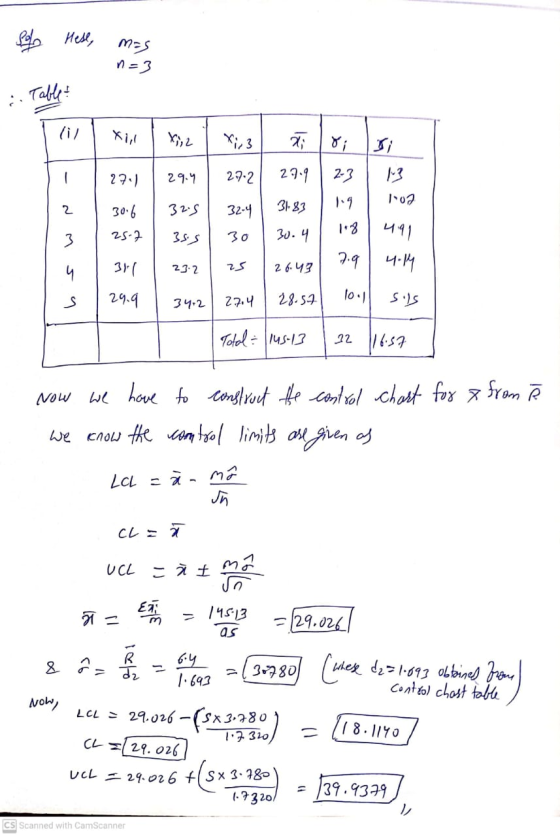
 Short Answer Question We have m = 5 preliminary samples of size n 3 (some numbers have unfortunately been erased by accident by a clumsy co-op student): i 11,1 2,2 1 27.1 29.4 2 30.6 32.5 3 25.7 35.5 4 31.1 23.2 5 24.1 34.2 1.9 2,3 27.9 32.4 31.83 30 30.4 25 26.43 27.4 28.57 total: 145.13 Si 1.3 1.07 4.91 7.9 10.1 32 5.15 16.57 What is the control chart (give the interval) for X from R?
We have m = 5 preliminary samples of size n = 3 (some numbers have unfortunately...
 We have m = 5 preliminary samples of size n = 3 (some numbers have unfortunately been erased by accident by a clumsy co-op student): 24,2 1 27.1 29.4 2 30.6 32.5 3 25.7 35.5 4 31.1 23.2 5 24.1 34.2 11,3 27.9 32.4 31.83 1.9 30 30.4 25 26.43 7.9 27.4 28.57 10.1 total: 145.13 32 Si 1.3 1.07 4.91 5.15 16.57 What is the control chart (give the interval) for X from 5?
29. Short Answer Question We have m = 5 preliminary samples of size n = 3...
 29. Short Answer Question We have m = 5 preliminary samples of size n = 3 (some numbers have unfortunately been erased by accident by a clumsy co-op student): 1.9 27.1 29.4 2 30.6 32.5 3 25.7 35.5 31.1 23.2 5 24.1 34.2 1.3 1.07 4.91 27.9 31.83 30.4 26.43 28.57 145.13 32.4 30 25 27.4 total: 4 7.9 10.1 32 5.15 16.57 What is the control chart (give the interval) for X from R?
Short Answer Question We have m = 5 preliminary samples of size n = 3 (some...
 Short Answer Question We have m = 5 preliminary samples of size n = 3 (some numbers have unfortunately been erased by accident by a clumsy co-op student): 2,2 1 27.1 29.4 2 30.6 32.5 3 25.7 35.5 4 31.1 23.2 5 24.1 34.2 1.9 21,3 27.9 32.4 31.83 30 30.4 25 26.43 27.4 28.57 total: 145.13 Si 1.3 1.07 4.91 7.9 10.1 32 5.15 16.57 What is the control chart (give the interval) for X from R?
5. Short Answer Question We have m = 5 preliminary samples of size n = 3...
 5. Short Answer Question We have m = 5 preliminary samples of size n = 3 (some numbers have unfortunately been erased by accident by a clumsy co-op student): ri 1.9 2,2 1.3 1 27.1 29.4 27.9 2 30.6 32.5 32.4 31.83 3 25.7 35.5 30 30.4 4 31.1 23.2 26.43 5 24.1 34.2 27.4 28.57 total: 145.13 Si 1.3 1.07 4.91 25 7.9 10.1 32 5.15 16.57 What is the control chart (give the interval) for X from R?
Short Answer Question We have m = 5 preliminary samples of size n = 3 (some...
 Short Answer Question We have m = 5 preliminary samples of size n = 3 (some numbers have unfortunately been erased by accident by a clumsy co-op student): ri i 1 1.9 21,1 11,2 27.1 29.4 2 30.6 32.5 3 25.7 35.5 4 31.1 23.2 5 24.1 34.2 V 1,3 27.9 32.4 31.83 30 30.4 25 26.43 27.4 28.57 total: 145.13 Si 1.3 1.07 4.91 7.9 10.1 32 5.15 16.57 What is the control chart (give the interval) for X...
We have m = 5 preliminary samples of size n = 3 (some numbers have unfortunately...
 We have m = 5 preliminary samples of size n = 3 (some numbers have unfortunately been erased by accident by a clumsy co-op student): ri Si 1.3 1.07 1.9 Ti.1 11,2 1 27.1 29.4 2 30.6 32.5 3 25.7 35.5 4 31.1 23.2 5 24.1 34.2 11,3 27.9 32.4 31.83 30 30.4 25 26.43 27.4 28.57 total: 145.13 4.91 7.9 10.1 32 5.15 16.57 What is the control chart (give the interval) for X from S?
We have m = 5 preliminary samples of size n = 3 (some numbers have unfortunately...
 We have m = 5 preliminary samples of size n = 3 (some numbers have unfortunately been erased by accident by a clumsy co-op student): i 113 ri 1.9 Ti, 1 T.2 1 27.1 29.4 2 30.6 32.5 3 25.7 35.5 4 31.1 23.2 5 24.1 34.2 Si 1.3 1.07 4.91 32.4 30 25 27.4 total: 27.9 31.83 30.4 26.43 28.57 145.13 7.9 10.1 32 5.15 16.57 What is the control chart (give the interval) for X from R?
28. Short Answer Question We have m = 5 preliminary samples of size n = 3...
 28. Short Answer Question We have m = 5 preliminary samples of size n = 3 (some numbers have unfortunately been erased by accident by a clumsy co-op student): . ri 1 7,1 27.1 29.4 2 30.6 32.5 3 25.7 35.5 31.1 23.2 5 24.1 34.2 1.9 0,3 27.9 32.4 31.83 30 30.4 25 26.43 27.4 28.57 total: 145.13 Si 1.3 1.07 4.91 4 7.9 10.1 32 5.15 16.57 What is the control chart (give the interval) for X from...
 Short Answer Question We have m = 5 preliminary samples of size n = 3 (some numbers have unfortunately been erased by accident by a dumsy co-op student): 8 1 27.1 294 27.9 1.3 2 30.6 32.5 324 31.83 1.9 1.07 3 25.7 35.5 30 30.4 4.91 4 31.123.2 25 26.43 7.9 5 24.1 34.2 27.4 28.57 10.1 5.15 total: 145.13 32 16.57 What is the control chart (give the interval) for X from S?
 Short Answer Question We have m = 5 preliminary samples of size n 3 (some numbers have unfortunately been erased by accident by a clumsy co-op student): i 11,1 2,2 1 27.1 29.4 2 30.6 32.5 3 25.7 35.5 4 31.1 23.2 5 24.1 34.2 1.9 2,3 27.9 32.4 31.83 30 30.4 25 26.43 27.4 28.57 total: 145.13 Si 1.3 1.07 4.91 7.9 10.1 32 5.15 16.57 What is the control chart (give the interval) for X from R?
 We have m = 5 preliminary samples of size n = 3 (some numbers have unfortunately been erased by accident by a clumsy co-op student): 24,2 1 27.1 29.4 2 30.6 32.5 3 25.7 35.5 4 31.1 23.2 5 24.1 34.2 11,3 27.9 32.4 31.83 1.9 30 30.4 25 26.43 7.9 27.4 28.57 10.1 total: 145.13 32 Si 1.3 1.07 4.91 5.15 16.57 What is the control chart (give the interval) for X from 5?
 29. Short Answer Question We have m = 5 preliminary samples of size n = 3 (some numbers have unfortunately been erased by accident by a clumsy co-op student): 1.9 27.1 29.4 2 30.6 32.5 3 25.7 35.5 31.1 23.2 5 24.1 34.2 1.3 1.07 4.91 27.9 31.83 30.4 26.43 28.57 145.13 32.4 30 25 27.4 total: 4 7.9 10.1 32 5.15 16.57 What is the control chart (give the interval) for X from R?
 Short Answer Question We have m = 5 preliminary samples of size n = 3 (some numbers have unfortunately been erased by accident by a clumsy co-op student): 2,2 1 27.1 29.4 2 30.6 32.5 3 25.7 35.5 4 31.1 23.2 5 24.1 34.2 1.9 21,3 27.9 32.4 31.83 30 30.4 25 26.43 27.4 28.57 total: 145.13 Si 1.3 1.07 4.91 7.9 10.1 32 5.15 16.57 What is the control chart (give the interval) for X from R?
 5. Short Answer Question We have m = 5 preliminary samples of size n = 3 (some numbers have unfortunately been erased by accident by a clumsy co-op student): ri 1.9 2,2 1.3 1 27.1 29.4 27.9 2 30.6 32.5 32.4 31.83 3 25.7 35.5 30 30.4 4 31.1 23.2 26.43 5 24.1 34.2 27.4 28.57 total: 145.13 Si 1.3 1.07 4.91 25 7.9 10.1 32 5.15 16.57 What is the control chart (give the interval) for X from R?
 Short Answer Question We have m = 5 preliminary samples of size n = 3 (some numbers have unfortunately been erased by accident by a clumsy co-op student): ri i 1 1.9 21,1 11,2 27.1 29.4 2 30.6 32.5 3 25.7 35.5 4 31.1 23.2 5 24.1 34.2 V 1,3 27.9 32.4 31.83 30 30.4 25 26.43 27.4 28.57 total: 145.13 Si 1.3 1.07 4.91 7.9 10.1 32 5.15 16.57 What is the control chart (give the interval) for X...
 We have m = 5 preliminary samples of size n = 3 (some numbers have unfortunately been erased by accident by a clumsy co-op student): ri Si 1.3 1.07 1.9 Ti.1 11,2 1 27.1 29.4 2 30.6 32.5 3 25.7 35.5 4 31.1 23.2 5 24.1 34.2 11,3 27.9 32.4 31.83 30 30.4 25 26.43 27.4 28.57 total: 145.13 4.91 7.9 10.1 32 5.15 16.57 What is the control chart (give the interval) for X from S?
 We have m = 5 preliminary samples of size n = 3 (some numbers have unfortunately been erased by accident by a clumsy co-op student): i 113 ri 1.9 Ti, 1 T.2 1 27.1 29.4 2 30.6 32.5 3 25.7 35.5 4 31.1 23.2 5 24.1 34.2 Si 1.3 1.07 4.91 32.4 30 25 27.4 total: 27.9 31.83 30.4 26.43 28.57 145.13 7.9 10.1 32 5.15 16.57 What is the control chart (give the interval) for X from R?
 28. Short Answer Question We have m = 5 preliminary samples of size n = 3 (some numbers have unfortunately been erased by accident by a clumsy co-op student): . ri 1 7,1 27.1 29.4 2 30.6 32.5 3 25.7 35.5 31.1 23.2 5 24.1 34.2 1.9 0,3 27.9 32.4 31.83 30 30.4 25 26.43 27.4 28.57 total: 145.13 Si 1.3 1.07 4.91 4 7.9 10.1 32 5.15 16.57 What is the control chart (give the interval) for X from...
Most questions answered within 3 hours.
-
HELP WITH SAS
Run the following DATA step to create a SAS data set called
ABC_CORP....
asked 52 seconds from now -
A researcher wishes to study the cumulative effects of several
combinations of HIV drugs. There are...
asked 18 minutes ago -
How
to make a simple game of whack a mole in pygame
asked 2 minutes ago -
Write a c/c++ program to read a list of students from a file and
create a...
asked 11 minutes ago -
Identify two different methods for collecting data in
qualitative research. What are the benefits and challenges...
asked 11 minutes ago -
I am suppose to have my array before the main class but I am
getting the...
asked 13 minutes ago -
Your task is to design the page table for the 32bit Pentium
microprocessor. Answer the following...
asked 20 minutes ago -
The Paradise Shoes Company has estimated its weekly TVC function
from data collected over the past...
asked 18 minutes ago -
Although Epicurus advocates pursuing pleasure for the
good life, discuss a few reasons why he does...
asked 36 minutes ago -
Problem 1: Present entries to record the selected transactions
described below:
(a)
Issued $2,790,000 of 5-year,...
asked 42 minutes ago -
Using technology to support HR activities increases:
a.
the efficiency of the administrative HR functions.
b....
asked 43 minutes ago -
1. List the features used to classify leaf
types.
2. List some characteristics that are shared...
asked 48 minutes ago