
Homework Answers
Add Answer to:
Let X represent the full length of a certain species of newt. Assume that X has...
Let X represent the full length of a certain species of newt. Assume that X has...
 Let X represent the full length of a certain species of newt. Assume that X has a normal probability distribution with mean 35.3 inches and standard deviation 5.9 inches You intend to measure a random sample of n = 101 newts. The bell curve below represents the distibution of these sample means. The scale on the horizontal axis is the standard error of the sampling distribution. Complete the indicated boxes, correct to two decimal places.
Let X represent the full length of a certain species of newt. Assume that X has...
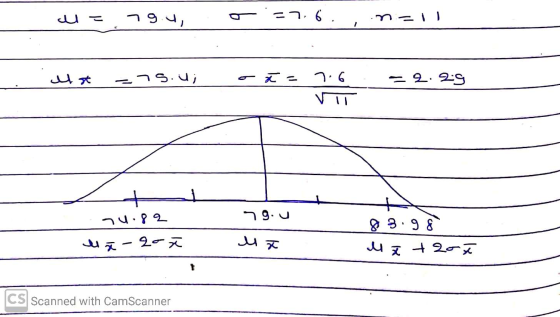
 Let X represent the full length of a certain species of newt. Assume that X has a normal probability distribution with mean 110.7 inches and standard deviation 3.6 inches. You intend to measure a random sample of n = 82 newts. The bell curve below represents the distibution of these sample means. The scale on the horizontal axis is the standard error of the sampling distribution. Complete the indicated boxes, correct to two decimal places Points possible: 2
Let X represent the full height of a certain species of tree. Assume that X has...
 Let X represent the full height of a certain species of tree. Assume that X has a normal probability distribution with mean 210 ft and standard deviation 18.6 ft. You intend to measure a random sample of n = 108 trees. The bell curve below represents the distibution of these sample means. The scale on the horizontal axis is the standard error of the sampling distribution. Complete the indicated boxes, correct to two decimal places. 4 = =
Let X represent the full height of a certain species of tree. Assume that X has...
 Let X represent the full height of a certain species of tree. Assume that X has a normal probability distribution with mean 88.6 ft and standard deviation 71.8 ft. You intend to measure a random sample of n = 132 trees. The bell curve below represents the distibution of these sample means. The scale on the horizontal axis is the standard error of the sampling distribution. Complete the indicated boxes, correct to two decimal places. Points possible: 1 Unlimited attempts....
Let X represent the full height of a certain species of tree. Assume that X has...
 Let X represent the full height of a certain species of tree. Assume that X has a normal probability distribution with mean 196.5 ft and standard deviation 65 ft. You intend to measure a random sample of n = 229 trees. The bell curve below represents the distibution of these sample means. The scale on the horizontal axis is the standard error of the sampling distribution Complete the indicate boxes, correct to two decimal places.
Let X represent the full height of a certain species of tree. Assume that X has...
 Let X represent the full height of a certain species of tree. Assume that X has a normal probability distribution with mean 156.7 ft and standard deviation 39.6 ft. You intend to measure a random sample of n 124 trees. The bell curve below represents the distibution of these sample means. The scale on the horizont boxes, correct to two decimal places. al axis is the standard error of the sampling distribution. Complete the indicated Ơi
Let XX represent the full height of a certain species of tree. Assume that XX has...
Let XX represent the full height of a certain species of tree. Assume that XX has a normal probability distribution with mean 208.8 ft and standard deviation 32.2 ft. You intend to measure a random sample of n=118n=118 trees. The bell curve below represents the distibution of these sample means. The scale on the horizontal axis is the standard error of the sampling distribution. Complete the indicated boxes, correct to two decimal places.
Let X represent the full height of a certain species of tree. Assume that X has...
Let X represent the full height of a certain species of tree. Assume that X has a normal probability distribution with mean 33.7 ft and standard deviation 19.7 ft. You intend to measure a random sample of n=113 trees. The bell curve below represents the distribution of these sample means. The scale on the horizontal axis is the standard error (standard deviation) of the sampling distribution. Complete the indicated boxes, correct to two decimal places.
Let X represent the full height of a certain species of tree. Assume that X has...
 Let X represent the full height of a certain species of tree.
Assume that X has a normal probability distribution with mean 33.7
ft and standard deviation 19.7 ft.
You intend to measure a random sample of n=113 trees. The bell
curve below represents the distribution of these sample means. The
scale on the horizontal axis is the standard error (standard
deviation) of the sampling distribution. Complete the indicated
boxes, correct to two decimal places.
μx¯=
σx¯=
Let X represent the full height of a certain species of tree.
Assume that X has a normal probability distribution with mean 33.7
ft and standard deviation 19.7 ft.
You intend to measure a random sample of n=113 trees. The bell
curve below represents the distribution of these sample means. The
scale on the horizontal axis is the standard error (standard
deviation) of the sampling distribution. Complete the indicated
boxes, correct to two decimal places.
μx¯=
σx¯=
Let X represent the full height of a certain species of tree. Assume that X has...
 Let X represent the full height of a certain species of tree. Assume that X has a normal probability distribution with mean 6 ft and standard deviation 55.7 ft. You intend to measure a random sample of n 80 trees. The bell curve below represents the distibution of these sample means. The scale on the horizontal boxes, correct to two decimal places. Points possible: 1 Unlimited attempts. License
 Let X represent the full length of a certain species of newt. Assume that X has a normal probability distribution with mean 35.3 inches and standard deviation 5.9 inches You intend to measure a random sample of n = 101 newts. The bell curve below represents the distibution of these sample means. The scale on the horizontal axis is the standard error of the sampling distribution. Complete the indicated boxes, correct to two decimal places.
 Let X represent the full length of a certain species of newt. Assume that X has a normal probability distribution with mean 110.7 inches and standard deviation 3.6 inches. You intend to measure a random sample of n = 82 newts. The bell curve below represents the distibution of these sample means. The scale on the horizontal axis is the standard error of the sampling distribution. Complete the indicated boxes, correct to two decimal places Points possible: 2
 Let X represent the full height of a certain species of tree. Assume that X has a normal probability distribution with mean 210 ft and standard deviation 18.6 ft. You intend to measure a random sample of n = 108 trees. The bell curve below represents the distibution of these sample means. The scale on the horizontal axis is the standard error of the sampling distribution. Complete the indicated boxes, correct to two decimal places. 4 = =
 Let X represent the full height of a certain species of tree. Assume that X has a normal probability distribution with mean 88.6 ft and standard deviation 71.8 ft. You intend to measure a random sample of n = 132 trees. The bell curve below represents the distibution of these sample means. The scale on the horizontal axis is the standard error of the sampling distribution. Complete the indicated boxes, correct to two decimal places. Points possible: 1 Unlimited attempts....
 Let X represent the full height of a certain species of tree. Assume that X has a normal probability distribution with mean 196.5 ft and standard deviation 65 ft. You intend to measure a random sample of n = 229 trees. The bell curve below represents the distibution of these sample means. The scale on the horizontal axis is the standard error of the sampling distribution Complete the indicate boxes, correct to two decimal places.
 Let X represent the full height of a certain species of tree. Assume that X has a normal probability distribution with mean 156.7 ft and standard deviation 39.6 ft. You intend to measure a random sample of n 124 trees. The bell curve below represents the distibution of these sample means. The scale on the horizont boxes, correct to two decimal places. al axis is the standard error of the sampling distribution. Complete the indicated Ơi
 Let X represent the full height of a certain species of tree.
Assume that X has a normal probability distribution with mean 33.7
ft and standard deviation 19.7 ft.
You intend to measure a random sample of n=113 trees. The bell
curve below represents the distribution of these sample means. The
scale on the horizontal axis is the standard error (standard
deviation) of the sampling distribution. Complete the indicated
boxes, correct to two decimal places.
μx¯=
σx¯=
Let X represent the full height of a certain species of tree.
Assume that X has a normal probability distribution with mean 33.7
ft and standard deviation 19.7 ft.
You intend to measure a random sample of n=113 trees. The bell
curve below represents the distribution of these sample means. The
scale on the horizontal axis is the standard error (standard
deviation) of the sampling distribution. Complete the indicated
boxes, correct to two decimal places.
μx¯=
σx¯=
 Let X represent the full height of a certain species of tree. Assume that X has a normal probability distribution with mean 6 ft and standard deviation 55.7 ft. You intend to measure a random sample of n 80 trees. The bell curve below represents the distibution of these sample means. The scale on the horizontal boxes, correct to two decimal places. Points possible: 1 Unlimited attempts. License
Most questions answered within 3 hours.
-
Two waves are traveling on a string, one with a wave function,
y1 = 0.05sin(4x -...
asked 3 minutes ago -
Develop an ideal customer profile for three Dell Customer
groups( a supplier, a global business, and...
asked 5 minutes ago -
Suppose, for any future year, the probability its October rain
is more than 3 inches is...
asked 10 minutes ago -
Solve the following systems of linear equations using
substitution 12p + 3q = 15 6q +...
asked 17 minutes ago -
Prof. D went grocery shopping and purchased one dozen eggs and
one pound of flour (all...
asked 24 minutes ago -
If
somehow loop of Henle were removed - that is if the proximal tubule
was connected...
asked 24 minutes ago -
Add 1ml of 0.18M of HCl (aq) to 1ml of 0.2M of [Ag(NH3)2]Br
(aq).
Write the...
asked 31 minutes ago -
1. Smoke detectors use Am-241, an alpha emitter, to detect smoke
particles. A parent is concerned...
asked 36 minutes ago -
Scenario: Web application developed to capture customers
demographic and financial information for filling their taxes. This...
asked 39 minutes ago -
Which of the following statements are true?
1. Glass is mostly silicon dioxide and so when...
asked 1 hour ago -
Korman Company has the following securities in its portfolio of
equity securities on December 31, 2018:...
asked 1 hour ago -
Using the 12th edition of Language Awareness,
complete the following assignment:
After reading Akiba Solomon's "Thugs....
asked 1 hour ago