
Homework Answers
Question is answered below.
Values of test statistic is absolutely correct. I have cross checked it.

Add Answer to:
A sports researchers interested in determining if there is a relationship between the number of home...
o A sports researcher is interested in determining if there is a relationship between the number...
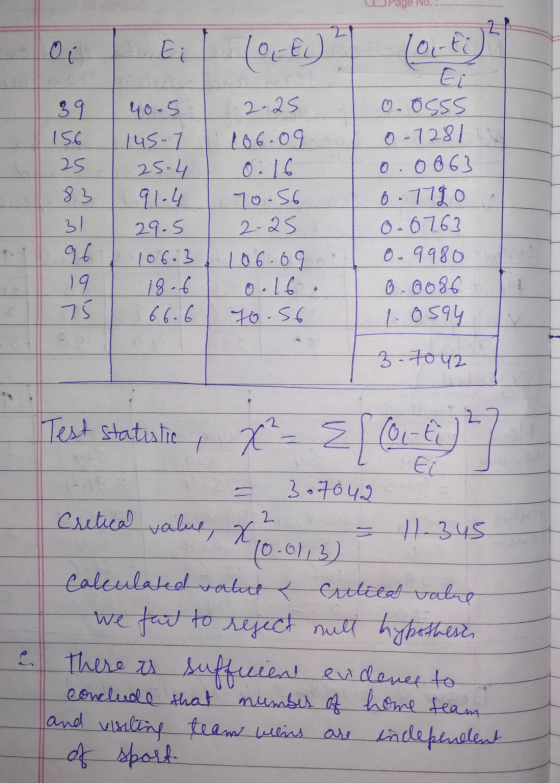
 o A sports researcher is interested in determining if there is a relationship between the number of home team and visiting team wins and different sports. A random sample of 526 games is selected and the results are given below. Calculate the chi-square test statistie y used to test the claim that the number of home team and visiting team wins is independent of the sport. Use a 0.01 Home team wins Visiting team wins Football Basketball Soccer Baseball 39...
A sports researcher is interested in determining if there is a relationship between the number of...
A sports researcher is interested in determining if there is a relationship between the number of home team and visiting team wins and different sports. A random sample of 526 games is selected and the results are given below. Find the expected frequency for E 2,2 to test the claim that the number of home team and visiting team wins are independent of the sport. Round to the nearest tenth if necessary. Football Basketball Soccer Baseball Total Home Team 38...
A sports researcher is interested in determining if there is a relationship between the number of...
 A sports researcher is interested in determining if there is a relationship between the number of home team and visiting team wins and different sports A random sample of 526 games is selected and the results are given below Assuming the row and column Classifications we independent, find an estimate for the expected cell count of cell E 22 Football Basketbal Soccer Baseball Vam w 50 28 1051
U Winning team data were collected for teams in different sports, with the results given in...
 U Winning team data were collected for teams in different sports, with the results given in the table below. Use TH-43/34 PLUS the TH-6384 Plus results at 0.05 level of significance to test the claim that home visitor wins we Independent of the sport Y - Test Y-5.344751050 -0.142241792 ar Hockey Football Home team wins 113 57 42 40 Visiting team wins 00 39 51 33 the null hypothesis that home visitor wins are independent of the sport. It appears...
Winning team data were collected for teams in different sports, with the results given in the...
Winning team data were collected for teams in different sports, with the results given in the table below. Use the TI-83/84 Plus results at a 0.050.05 level of significance to test the claim that home/visitor wins are independent of the sport. TI-83/84 PLUS chi squared minus Testχ2−Test chi squared equals 4.659420123χ2=4.659420123 Upper P equals 0.1985035955P=0.1985035955 df equals 3df=3 BasketballBasketball Baseball Hockey Football Home team winsHome team wins 139139 5454 7777 6262 Visiting team winsVisiting team wins 8181 5050 4343 3737...
Winning-team data were collected for teams in different sports, with the results given in the accompanying...
 Winning-team data were collected for teams in different sports,
with the results given in the accompanying table. Use a 0.05
significance to test the claim that home/ visitor wins are
independent of the sport.
Please show ALL steps.
4-Winning-team data were collected for teams in different sports, with the results given in the accompanying table. Use a 0.05 significance to test the claim that homel visitor wins are independent of the sport. Home team wins Basketball Baseball Hockey Football 127...
Winning-team data were collected for teams in different sports,
with the results given in the accompanying table. Use a 0.05
significance to test the claim that home/ visitor wins are
independent of the sport.
Please show ALL steps.
4-Winning-team data were collected for teams in different sports, with the results given in the accompanying table. Use a 0.05 significance to test the claim that homel visitor wins are independent of the sport. Home team wins Basketball Baseball Hockey Football 127...
The tables below shows the results of a multiple linear regression analysis relating the sale price...
 The tables below shows the results of a multiple linear regression analysis relating the sale price y of a house (in dollars) versus LandVal (in dollars), Improvement (in dollars) and Area (in square feet): MS Source DF 877,967292656 46.66 100,349 6,272 978,316 0.00001 Regression 3 Residual16 Total 19 Predictor CoeffStd. ErrorT-valueP-value Intercept 1470 5746 0.26 0801 LandVal08145 0.5122 1.59 Improvement 0.8204 0.2112 3.88 2.05 0.131 0.001 Area 13.529 6.856 0.057 At alpha, a - 0.01 we can say that the...
12. Winning team data were collected for teams in different sports, with the results given in...
 12. Winning team data were collected for teams in different sports, with the results given in the table below. Use a 0.05 level of significance to test the claim that home/visitor wins are independent of the sport Home Team Wins Visiting Team Wins Basketball 127 71 Baseball 53 47 Hockey 50 43 Football 57 42 a. Write the null and alternative hypotheses. Label the claim. b. Draw the graph and shade the critical area(s). Place the critical value(s) on the...
12. Winning-team data were collected for teams in different sports, with the results given in the...
 12. Winning-team data were collected for teams in different sports, with the results given in the table below. Use a 0.05 level of significance to test the claim that home/visitor wins are independent of the sport. Basketball Baseball Hockey Football 127 53 50 57 Home Team Wins Visiting Team Wins 71 47 43 42 a. Write the null and alternative hypotheses. Label the claim. b. Draw the graph and shade the critical area(s). Place the critical value(s) on the graph....
Problem. Alex Rodriguez is interested in the relationship between the number of games won by a...
 Problem. Alex Rodriguez is interested in the relationship between the number of games won by a major league baseball team in a season (1) and the team's batting average (x). He collected data and obtained the following ANOVA table for a simple linear regression model, y = 3, +3.x + Mean Square F Significance F Regression Residual df ? 15 ? Sum of Squares 248.0 600.0 348.0 Total (1) What is the sample size n? Select one: 15 16 17...
 o A sports researcher is interested in determining if there is a relationship between the number of home team and visiting team wins and different sports. A random sample of 526 games is selected and the results are given below. Calculate the chi-square test statistie y used to test the claim that the number of home team and visiting team wins is independent of the sport. Use a 0.01 Home team wins Visiting team wins Football Basketball Soccer Baseball 39...
 A sports researcher is interested in determining if there is a relationship between the number of home team and visiting team wins and different sports A random sample of 526 games is selected and the results are given below Assuming the row and column Classifications we independent, find an estimate for the expected cell count of cell E 22 Football Basketbal Soccer Baseball Vam w 50 28 1051
 U Winning team data were collected for teams in different sports, with the results given in the table below. Use TH-43/34 PLUS the TH-6384 Plus results at 0.05 level of significance to test the claim that home visitor wins we Independent of the sport Y - Test Y-5.344751050 -0.142241792 ar Hockey Football Home team wins 113 57 42 40 Visiting team wins 00 39 51 33 the null hypothesis that home visitor wins are independent of the sport. It appears...
 Winning-team data were collected for teams in different sports,
with the results given in the accompanying table. Use a 0.05
significance to test the claim that home/ visitor wins are
independent of the sport.
Please show ALL steps.
4-Winning-team data were collected for teams in different sports, with the results given in the accompanying table. Use a 0.05 significance to test the claim that homel visitor wins are independent of the sport. Home team wins Basketball Baseball Hockey Football 127...
Winning-team data were collected for teams in different sports,
with the results given in the accompanying table. Use a 0.05
significance to test the claim that home/ visitor wins are
independent of the sport.
Please show ALL steps.
4-Winning-team data were collected for teams in different sports, with the results given in the accompanying table. Use a 0.05 significance to test the claim that homel visitor wins are independent of the sport. Home team wins Basketball Baseball Hockey Football 127...
 The tables below shows the results of a multiple linear regression analysis relating the sale price y of a house (in dollars) versus LandVal (in dollars), Improvement (in dollars) and Area (in square feet): MS Source DF 877,967292656 46.66 100,349 6,272 978,316 0.00001 Regression 3 Residual16 Total 19 Predictor CoeffStd. ErrorT-valueP-value Intercept 1470 5746 0.26 0801 LandVal08145 0.5122 1.59 Improvement 0.8204 0.2112 3.88 2.05 0.131 0.001 Area 13.529 6.856 0.057 At alpha, a - 0.01 we can say that the...
 12. Winning team data were collected for teams in different sports, with the results given in the table below. Use a 0.05 level of significance to test the claim that home/visitor wins are independent of the sport Home Team Wins Visiting Team Wins Basketball 127 71 Baseball 53 47 Hockey 50 43 Football 57 42 a. Write the null and alternative hypotheses. Label the claim. b. Draw the graph and shade the critical area(s). Place the critical value(s) on the...
 12. Winning-team data were collected for teams in different sports, with the results given in the table below. Use a 0.05 level of significance to test the claim that home/visitor wins are independent of the sport. Basketball Baseball Hockey Football 127 53 50 57 Home Team Wins Visiting Team Wins 71 47 43 42 a. Write the null and alternative hypotheses. Label the claim. b. Draw the graph and shade the critical area(s). Place the critical value(s) on the graph....
 Problem. Alex Rodriguez is interested in the relationship between the number of games won by a major league baseball team in a season (1) and the team's batting average (x). He collected data and obtained the following ANOVA table for a simple linear regression model, y = 3, +3.x + Mean Square F Significance F Regression Residual df ? 15 ? Sum of Squares 248.0 600.0 348.0 Total (1) What is the sample size n? Select one: 15 16 17...
Most questions answered within 3 hours.
-
For the following reaction, 0.128 moles of
potassium hydrogen sulfateare mixed with
0.504 moles of potassium...
asked 1 minute ago -
1. What is the present value of $400, three years in the future
if the interest...
asked 34 minutes ago -
The labor force minus the number of employed equals the number
of unemployed.
a. True
b....
asked 2 hours ago -
Determine the mass in units of grams [g] of 0.49 moles [mol]
of a new fictitious...
asked 3 hours ago -
A horizontal mass of M=5kg is on a spring and stretched to
x=0.5m when released from...
asked 4 hours ago -
26 of 50
"I have worked at the Arizona Humane Society for ten years, and
have...
asked 4 hours ago -
Compare and contrast zero based budgeting and incremental (or
base year) budgeting.
asked 4 hours ago -
4 pts 10. Which of the following hypothesis would be MOST
difficult to test experimentally? Group...
asked 4 hours ago -
A business owner makes 1,000 items a day. Each day he or she
contributes eight hours...
asked 4 hours ago -
A
circular loop in the plane of a paper lies inca0.65 T magnetic
field pointing into...
asked 4 hours ago -
A business owner is trying to decide whether to buy, rent, or
lease office space and...
asked 4 hours ago -
Thermal Storage Solar heating of a house is much more efficient
if there is a way...
asked 5 hours ago