

Homework Answers
a. Construct a scatter plot:
Bring data in to excel sheet.
Select both x and y variable and insert the scatter plot chart.
Option A is correct

b. Linear correlation coefficient r = 0.816
(Excel formula)

we have to run a regression analysis to find , is there a significant correlation exists between the variable or not
Go to data tab --> choose data analysis --> choose regression
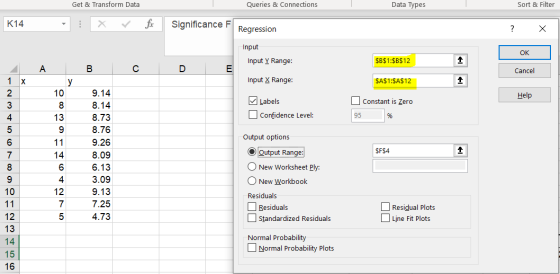
Result:

Significance F is nothing but P-value
P-value = 0.0022
If the p-value is less than the significance level (α=0.05):
- Decision: Reject the null hypothesis.
- Conclusion: "There is sufficient evidence to conclude that there is a significant linear relationship between x and y because the correlation coefficient is significantly different from zero."
Option B.
There is sufficent evidence to support the claim of a linear correlation between the two variables.
(c) identify the feature of the data that would be missed in part b
Option c
The scatterplot reveals a distince pattern that is a straight -line pattern woth positive slope
Add Answer to:
Use the given data set to complete parts (a) through (c) below. (Use a = 0.05.)...
Use the given data set to complete parts (a) through (C) below. (Use a = 0.05.)...
 Use the given data set to complete parts (a) through (C) below. (Use a = 0.05.) 10 9.14 8 8.15 13 8.74 9 8.77 11 9.27 14 8.09 6 6.13 4 3.09 12 9.13 5 4.75 7.26 Click here to view a table of critical values for the correlation coefficient. a. Construct a scatterplot. Choose the correct graph below. OA OB. OC. OD. AY 10- 8 10- 10 8 10- 8- 6 6- 6- . 6- 4 4 4- 4...
Use the given data set to complete parts (a) through (c) below. (Use a=0.05.) n х...
 Use the given data set to complete parts (a) through (c) below. (Use a=0.05.) n х 10 9.14 8 8.14 13 8.74 11 9.26 14 8.11 6 6.13 4 3.11 12 9.12 7 7.26 5 4.75 y 8.77 Click here to view a table of critical values for the correlation coefficient. a. Construct a scatterplot. Choose the correct graph below. O A. B. D Ay 10- AY 10- 8 лу 10- AY 10- 8- 8- 8- 6- 6- 6- 6-...
Use the given data set to complete parts (a) through (c) below. (Use a-0.05.) 10 9.13...
 Use the given data set to complete parts (a) through (c) below. (Use a-0.05.) 10 9.13 13 8.75 12 9.13 3.11 4.74 8.14 8.77 9.25 8.09 6.13 7.25 Click here to view a table of critical values for the correlation coefficient. a. Construct a scatterplot. Choose the correct graph below. OA. OB. O C. OD. 12 16 12 16 8 12 16 12 16 b. Find the linear correlation coefficient, r, then determine whether there is sufficient evidence to support...
... Use the given data set to complete parts (a) through (C) below. (Use a =...
 ... Use the given data set to complete parts (a) through (C) below. (Use a = 0.05.) X 6 7 10 7.45 8 6.76 13 12.74 9 7.11 11 7.81 14 8.84 4 5.39 12 8.14 5 5.72 y 6.08 6.41 Click here to view a table of critical values for the correlation coefficient. a. Construct a scatterplot. Choose the correct graph below. OA. OB. OC. OD 16- AY 16- AY 167 AY 16 12- 12 12 a 12- 8-...
Use the given dataset to complete parts (a) through (c) below. (Use a 0.05.) 676 12737812...
 Use the given dataset to complete parts (a) through (c) below. (Use a 0.05.) 676 12737812 8.83 608 38 38622 Cck here to view a table of critical values for the correlation coefficient a. Construct a scatterplot. Choose the correct graph below. OC. O A 16T 0 b. Find the linear correlation coefficient, r, then determine whether there is sufficient evidence to support the claim of a linear correlation between the two variables. DLL The linear correlation coefficient is a...
show work Show Work Question Help Use the given data set to complete parts (a) through...
 show work
Show Work Question Help Use the given data set to complete parts (a) through (c) below. (Use a = 0.05.) x 10 8 13 19 T 11 T 14 16 14 | y 7.46 6.77 12.74 7.12 7.81 8 .84 6.09 5.39 12 8.15 7 6.42 5 5.73 = Click here to view a table of critical values for the correlation coefficient a. Construct a scatterplot. Choose the correct graph below. OA OB. 638 12 16 06 12...
show work
Show Work Question Help Use the given data set to complete parts (a) through (c) below. (Use a = 0.05.) x 10 8 13 19 T 11 T 14 16 14 | y 7.46 6.77 12.74 7.12 7.81 8 .84 6.09 5.39 12 8.15 7 6.42 5 5.73 = Click here to view a table of critical values for the correlation coefficient a. Construct a scatterplot. Choose the correct graph below. OA OB. 638 12 16 06 12...
ui Use the given data set to complete parts (a) through (c) below (Use α:005) 10...
 ui Use the given data set to complete parts (a) through (c) below (Use α:005) 10 MA 6.78 2 74 642573 oss] )Click here to view a table of critical values for the correlation coefficient Sec b. Find the inear correlation coeficient r, then Sect (Round to three decimal places as needed ) determine whether there is suticient evidence to support the claim of a linear correlation between the two variables The linear correlation coeficient is r Using the linear...
Use the given data set to complete parts (a) through (c) below. (Use a = 0.05.)...
 Use the given data set to complete parts (a) through (c) below. (Use a = 0.05.) X 8 10 9.14 13 8.75 9 8.78 11 9.26 14 8.11 6 6.13 4 3.11 12 9.13 7 7.26 5 4.74 y 8.13 Click here to view a table of critical values for the correlation coefficient. a. Construct a scatterplot. Choose the correct graph below. OA. OB. OC. OD. AY 10 Ау 10- 8- AY 10- 8- 6- 4- 6- ......... 8- 6-...
Use the given data set to complete parts (a) through (c) below. (Use a = 0.05.)...
 Use the given data set to complete parts (a) through (c) below. (Use a = 0.05.) x v 10 9.14 8 8.13 13 8.74 9 8.77 11 9.27 14 8.09 6 6.13 4 3.09 12 9.13 7 7.26 5 4.75 1 | 3 Click here to view a table of critical values for the correlation coefficient. a. Construct a scatterplot. Choose the correct graph below. O A. O toot'n'to * TAŚ 12 16 d's 12' 16' °C 8 12 16...
so the given data set to complete parts (a) through (c) below. (Use q=0.06.) Question Help...
 so the given data set to complete parts (a) through (c) below. (Use q=0.06.) Question Help x у 10 9.13 8 8.13 13 8.74 9 8.76 11 925 14 8.11 6 6.14 4 3.11 12 9.13 7 7.26 473 Click here to view a table of critical values for the correlation coefficient. a. Construct a scatterplot. Choose the correct graph below. A OB Ос. OD Ay 10 @ 10 8 10 A 5 ******** 4 Ау 10 8 6 4...
 Use the given data set to complete parts (a) through (C) below. (Use a = 0.05.) 10 9.14 8 8.15 13 8.74 9 8.77 11 9.27 14 8.09 6 6.13 4 3.09 12 9.13 5 4.75 7.26 Click here to view a table of critical values for the correlation coefficient. a. Construct a scatterplot. Choose the correct graph below. OA OB. OC. OD. AY 10- 8 10- 10 8 10- 8- 6 6- 6- . 6- 4 4 4- 4...
 Use the given data set to complete parts (a) through (c) below. (Use a=0.05.) n х 10 9.14 8 8.14 13 8.74 11 9.26 14 8.11 6 6.13 4 3.11 12 9.12 7 7.26 5 4.75 y 8.77 Click here to view a table of critical values for the correlation coefficient. a. Construct a scatterplot. Choose the correct graph below. O A. B. D Ay 10- AY 10- 8 лу 10- AY 10- 8- 8- 8- 6- 6- 6- 6-...
 Use the given data set to complete parts (a) through (c) below. (Use a-0.05.) 10 9.13 13 8.75 12 9.13 3.11 4.74 8.14 8.77 9.25 8.09 6.13 7.25 Click here to view a table of critical values for the correlation coefficient. a. Construct a scatterplot. Choose the correct graph below. OA. OB. O C. OD. 12 16 12 16 8 12 16 12 16 b. Find the linear correlation coefficient, r, then determine whether there is sufficient evidence to support...
 ... Use the given data set to complete parts (a) through (C) below. (Use a = 0.05.) X 6 7 10 7.45 8 6.76 13 12.74 9 7.11 11 7.81 14 8.84 4 5.39 12 8.14 5 5.72 y 6.08 6.41 Click here to view a table of critical values for the correlation coefficient. a. Construct a scatterplot. Choose the correct graph below. OA. OB. OC. OD 16- AY 16- AY 167 AY 16 12- 12 12 a 12- 8-...
 Use the given dataset to complete parts (a) through (c) below. (Use a 0.05.) 676 12737812 8.83 608 38 38622 Cck here to view a table of critical values for the correlation coefficient a. Construct a scatterplot. Choose the correct graph below. OC. O A 16T 0 b. Find the linear correlation coefficient, r, then determine whether there is sufficient evidence to support the claim of a linear correlation between the two variables. DLL The linear correlation coefficient is a...
 show work
Show Work Question Help Use the given data set to complete parts (a) through (c) below. (Use a = 0.05.) x 10 8 13 19 T 11 T 14 16 14 | y 7.46 6.77 12.74 7.12 7.81 8 .84 6.09 5.39 12 8.15 7 6.42 5 5.73 = Click here to view a table of critical values for the correlation coefficient a. Construct a scatterplot. Choose the correct graph below. OA OB. 638 12 16 06 12...
show work
Show Work Question Help Use the given data set to complete parts (a) through (c) below. (Use a = 0.05.) x 10 8 13 19 T 11 T 14 16 14 | y 7.46 6.77 12.74 7.12 7.81 8 .84 6.09 5.39 12 8.15 7 6.42 5 5.73 = Click here to view a table of critical values for the correlation coefficient a. Construct a scatterplot. Choose the correct graph below. OA OB. 638 12 16 06 12...
 ui Use the given data set to complete parts (a) through (c) below (Use α:005) 10 MA 6.78 2 74 642573 oss] )Click here to view a table of critical values for the correlation coefficient Sec b. Find the inear correlation coeficient r, then Sect (Round to three decimal places as needed ) determine whether there is suticient evidence to support the claim of a linear correlation between the two variables The linear correlation coeficient is r Using the linear...
 Use the given data set to complete parts (a) through (c) below. (Use a = 0.05.) X 8 10 9.14 13 8.75 9 8.78 11 9.26 14 8.11 6 6.13 4 3.11 12 9.13 7 7.26 5 4.74 y 8.13 Click here to view a table of critical values for the correlation coefficient. a. Construct a scatterplot. Choose the correct graph below. OA. OB. OC. OD. AY 10 Ау 10- 8- AY 10- 8- 6- 4- 6- ......... 8- 6-...
 Use the given data set to complete parts (a) through (c) below. (Use a = 0.05.) x v 10 9.14 8 8.13 13 8.74 9 8.77 11 9.27 14 8.09 6 6.13 4 3.09 12 9.13 7 7.26 5 4.75 1 | 3 Click here to view a table of critical values for the correlation coefficient. a. Construct a scatterplot. Choose the correct graph below. O A. O toot'n'to * TAŚ 12 16 d's 12' 16' °C 8 12 16...
 so the given data set to complete parts (a) through (c) below. (Use q=0.06.) Question Help x у 10 9.13 8 8.13 13 8.74 9 8.76 11 925 14 8.11 6 6.14 4 3.11 12 9.13 7 7.26 473 Click here to view a table of critical values for the correlation coefficient. a. Construct a scatterplot. Choose the correct graph below. A OB Ос. OD Ay 10 @ 10 8 10 A 5 ******** 4 Ау 10 8 6 4...
Most questions answered within 3 hours.
-
Calculate the number density of argon gas at a temperature of
24C and a pressure of...
asked 2 hours ago -
Alternative
Classification
How to Estimate
Probabilities from Data? ( For continuous Attributes)
And How to generate...
asked 2 hours ago -
An explosion breaks a 20.0-kg object into three parts. The
object is initially moving at a...
asked 3 hours ago -
Calculate the approximate number of residues of Rubisco, which
is involved in carbon fixation in plants,...
asked 4 hours ago -
Other decisions about scientific claims can have a much broader
impact.ENERGYarrow-10x10.png, environment, health, security - all...
asked 5 hours ago -
I need to write a research paper and work cited about this
topic: The United States...
asked 6 hours ago -
Hello! I was wondering if I could have some help?
If the vapor pressure of carvone...
asked 6 hours ago -
An economist wants to estimate the mean per capita income (in
thousands of dollars) for a...
asked 6 hours ago -
What would be the input/output characteristic of a circuit
obtained by putting two of your 2's-complementers...
asked 6 hours ago -
In Drosophila, the transition from the syncytial blastoderm
stage to the cellular blastoderm stage is a...
asked 7 hours ago -
Project management question:
Name 3 different types of resources (hint: humans are one
type)
asked 7 hours ago -
Consider the following reaction: C 2H 2( g) + 2H 2( g) C 2H 6(
g)...
asked 7 hours ago