![ui Use the given data set to complete parts (a) through (c) below (Use α:005) 10 MA 6.78 2 74 642573 oss] )Click here to view a table of critical values for the correlation coefficient Sec b. Find the inear correlation coeficient r, then Sect (Round to three decimal places as needed ) determine whether there is suticient evidence to support the claim of a linear correlation between the two variables The linear correlation coeficient is r Using the linear correlation coefficient found the two variables Choose the correct answer below in the previous step, determine whether there is sufficient evidence to support the claim of a linear correlation between st 11 OA. There is insuficient evidence to support the claim of a nonlinear correlation between the two va O B. There is sufficient evidence to support the claim of a nonlinear correlation between the two variables C. There is insufficient evidence to support the claim of a linear correlation between the two variables O D. There is sufficient evidence to support the claim of a linear correlation between the two variables MA C.Idensily the feature of the data that would be missed it part (b) was completed without constructing the scatterplot Choose the correct answer below 1.2 O A. The scatterplot does not reveal a perfect stralight-line pattorn, and contains one outlier ○ B. The scatterplot reveals a perfect straight-line pattern, except for the presence of one oder O C. The scaterplot reveals a pertect straight -ine patterm and does not contain any outlers 0 D. The scatterplot does not reveal a perfect straight-line pattern Se Unit](http://img.homeworklib.com/questions/66823400-0196-11ec-9a78-2b0bea249eac.png?x-oss-process=image/resize,w_560)
Homework Answers
b) r= 0.817
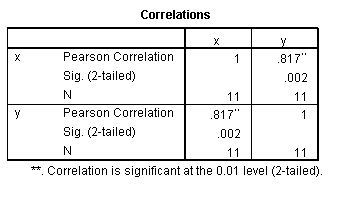
Since Pvalue= 0.002 <0.05 level of significance therefore significant.
There is sufficient evidence to support the claim of linear correlation between two variables. OPTION D
c) 
The scatter plot reveals a perfect straight line pattern , except for the presence of one outlier. OPTION B
Add Answer to:
ui Use the given data set to complete parts (a) through (c) below (Use α:005) 10...
Use the given dataset to complete parts (a) through (c) below. (Use a 0.05.) 676 12737812...
 Use the given dataset to complete parts (a) through (c) below. (Use a 0.05.) 676 12737812 8.83 608 38 38622 Cck here to view a table of critical values for the correlation coefficient a. Construct a scatterplot. Choose the correct graph below. OC. O A 16T 0 b. Find the linear correlation coefficient, r, then determine whether there is sufficient evidence to support the claim of a linear correlation between the two variables. DLL The linear correlation coefficient is a...
... Use the given data set to complete parts (a) through (C) below. (Use a =...
 ... Use the given data set to complete parts (a) through (C) below. (Use a = 0.05.) X 6 7 10 7.45 8 6.76 13 12.74 9 7.11 11 7.81 14 8.84 4 5.39 12 8.14 5 5.72 y 6.08 6.41 Click here to view a table of critical values for the correlation coefficient. a. Construct a scatterplot. Choose the correct graph below. OA. OB. OC. OD 16- AY 16- AY 167 AY 16 12- 12 12 a 12- 8-...
Use the given data set to complete parts (a) through (C) below. (Use a = 0.05.)...
 Use the given data set to complete parts (a) through (C) below. (Use a = 0.05.) 10 9.14 8 8.15 13 8.74 9 8.77 11 9.27 14 8.09 6 6.13 4 3.09 12 9.13 5 4.75 7.26 Click here to view a table of critical values for the correlation coefficient. a. Construct a scatterplot. Choose the correct graph below. OA OB. OC. OD. AY 10- 8 10- 10 8 10- 8- 6 6- 6- . 6- 4 4 4- 4...
Use the given data set to complete parts (a) through (c) below. (Use a = 0.05.)...
 Use the given data set to complete parts (a) through (c) below. (Use a = 0.05.) 5 х у 10 9.14 8 8.14 13 8.73 9 8.76 11 9.26 14 8.09 6 6.13 4 3.09 12 9.13 7 7.25 4.73 Click here to view a table of critical values for the correlation coefficient. a. Construct a scatterplot. Choose the correct graph below. OA. OB. O c. OD y AY 10- 8- Ay 10-1 a 10- 10- 8- 6- 8-1 8-...
Use the given data set to complete parts (a) through (c) below. (Use a-0.05.) 10 9.13...
 Use the given data set to complete parts (a) through (c) below. (Use a-0.05.) 10 9.13 13 8.75 12 9.13 3.11 4.74 8.14 8.77 9.25 8.09 6.13 7.25 Click here to view a table of critical values for the correlation coefficient. a. Construct a scatterplot. Choose the correct graph below. OA. OB. O C. OD. 12 16 12 16 8 12 16 12 16 b. Find the linear correlation coefficient, r, then determine whether there is sufficient evidence to support...
show work Show Work Question Help Use the given data set to complete parts (a) through...
 show work
Show Work Question Help Use the given data set to complete parts (a) through (c) below. (Use a = 0.05.) x 10 8 13 19 T 11 T 14 16 14 | y 7.46 6.77 12.74 7.12 7.81 8 .84 6.09 5.39 12 8.15 7 6.42 5 5.73 = Click here to view a table of critical values for the correlation coefficient a. Construct a scatterplot. Choose the correct graph below. OA OB. 638 12 16 06 12...
show work
Show Work Question Help Use the given data set to complete parts (a) through (c) below. (Use a = 0.05.) x 10 8 13 19 T 11 T 14 16 14 | y 7.46 6.77 12.74 7.12 7.81 8 .84 6.09 5.39 12 8.15 7 6.42 5 5.73 = Click here to view a table of critical values for the correlation coefficient a. Construct a scatterplot. Choose the correct graph below. OA OB. 638 12 16 06 12...
Use the given data set to complete parts (a) through (c) below. (Use a=0.05.) n х...
 Use the given data set to complete parts (a) through (c) below. (Use a=0.05.) n х 10 9.14 8 8.14 13 8.74 11 9.26 14 8.11 6 6.13 4 3.11 12 9.12 7 7.26 5 4.75 y 8.77 Click here to view a table of critical values for the correlation coefficient. a. Construct a scatterplot. Choose the correct graph below. O A. B. D Ay 10- AY 10- 8 лу 10- AY 10- 8- 8- 8- 6- 6- 6- 6-...
O B. ??. (Round to tree decimal places as needed) a linear comelation between the two...
 O B. ??. (Round to tree decimal places as needed) a linear comelation between the two O A There is suficient evidence to support the claim of a linear comlaion between the two va-ables 0?. There is suflert eidence to support the clain ofanonrear O C. There is O D. There is insufficent evidence to support the claim of a inear comelation bertwean the tbwo variables evidence to support the claim of a nonlinear wo variables two variables O A....
tound to 3 decimal places as needed pls This Question: 1 pt 18 of 24 16...
 tound to 3 decimal places as needed pls
This Question: 1 pt 18 of 24 16 completo) This Test: 24 pts possible Use the given data set to complete parts (a) through (c) below. (Us 0.05) x 10 B 13 9 7.47 6.78 12.75 7.11 11 781 14 BR) 6 6.08 & 539 7 12 8.15 574 Click here to view a table of critical values for the correlation coefficient a. Construct a scatterplot. Choose the correct graph below OD...
tound to 3 decimal places as needed pls
This Question: 1 pt 18 of 24 16 completo) This Test: 24 pts possible Use the given data set to complete parts (a) through (c) below. (Us 0.05) x 10 B 13 9 7.47 6.78 12.75 7.11 11 781 14 BR) 6 6.08 & 539 7 12 8.15 574 Click here to view a table of critical values for the correlation coefficient a. Construct a scatterplot. Choose the correct graph below OD...
Use the given data set to complete parts (a) through (c) below. (Use a = 0.05.)...
 Use the given data set to complete parts (a) through (c) below. (Use a = 0.05.) X 8 10 9.14 13 8.75 9 8.78 11 9.26 14 8.11 6 6.13 4 3.11 12 9.13 7 7.26 5 4.74 y 8.13 Click here to view a table of critical values for the correlation coefficient. a. Construct a scatterplot. Choose the correct graph below. OA. OB. OC. OD. AY 10 Ау 10- 8- AY 10- 8- 6- 4- 6- ......... 8- 6-...
 Use the given dataset to complete parts (a) through (c) below. (Use a 0.05.) 676 12737812 8.83 608 38 38622 Cck here to view a table of critical values for the correlation coefficient a. Construct a scatterplot. Choose the correct graph below. OC. O A 16T 0 b. Find the linear correlation coefficient, r, then determine whether there is sufficient evidence to support the claim of a linear correlation between the two variables. DLL The linear correlation coefficient is a...
 ... Use the given data set to complete parts (a) through (C) below. (Use a = 0.05.) X 6 7 10 7.45 8 6.76 13 12.74 9 7.11 11 7.81 14 8.84 4 5.39 12 8.14 5 5.72 y 6.08 6.41 Click here to view a table of critical values for the correlation coefficient. a. Construct a scatterplot. Choose the correct graph below. OA. OB. OC. OD 16- AY 16- AY 167 AY 16 12- 12 12 a 12- 8-...
 Use the given data set to complete parts (a) through (C) below. (Use a = 0.05.) 10 9.14 8 8.15 13 8.74 9 8.77 11 9.27 14 8.09 6 6.13 4 3.09 12 9.13 5 4.75 7.26 Click here to view a table of critical values for the correlation coefficient. a. Construct a scatterplot. Choose the correct graph below. OA OB. OC. OD. AY 10- 8 10- 10 8 10- 8- 6 6- 6- . 6- 4 4 4- 4...
 Use the given data set to complete parts (a) through (c) below. (Use a = 0.05.) 5 х у 10 9.14 8 8.14 13 8.73 9 8.76 11 9.26 14 8.09 6 6.13 4 3.09 12 9.13 7 7.25 4.73 Click here to view a table of critical values for the correlation coefficient. a. Construct a scatterplot. Choose the correct graph below. OA. OB. O c. OD y AY 10- 8- Ay 10-1 a 10- 10- 8- 6- 8-1 8-...
 Use the given data set to complete parts (a) through (c) below. (Use a-0.05.) 10 9.13 13 8.75 12 9.13 3.11 4.74 8.14 8.77 9.25 8.09 6.13 7.25 Click here to view a table of critical values for the correlation coefficient. a. Construct a scatterplot. Choose the correct graph below. OA. OB. O C. OD. 12 16 12 16 8 12 16 12 16 b. Find the linear correlation coefficient, r, then determine whether there is sufficient evidence to support...
 show work
Show Work Question Help Use the given data set to complete parts (a) through (c) below. (Use a = 0.05.) x 10 8 13 19 T 11 T 14 16 14 | y 7.46 6.77 12.74 7.12 7.81 8 .84 6.09 5.39 12 8.15 7 6.42 5 5.73 = Click here to view a table of critical values for the correlation coefficient a. Construct a scatterplot. Choose the correct graph below. OA OB. 638 12 16 06 12...
show work
Show Work Question Help Use the given data set to complete parts (a) through (c) below. (Use a = 0.05.) x 10 8 13 19 T 11 T 14 16 14 | y 7.46 6.77 12.74 7.12 7.81 8 .84 6.09 5.39 12 8.15 7 6.42 5 5.73 = Click here to view a table of critical values for the correlation coefficient a. Construct a scatterplot. Choose the correct graph below. OA OB. 638 12 16 06 12...
 Use the given data set to complete parts (a) through (c) below. (Use a=0.05.) n х 10 9.14 8 8.14 13 8.74 11 9.26 14 8.11 6 6.13 4 3.11 12 9.12 7 7.26 5 4.75 y 8.77 Click here to view a table of critical values for the correlation coefficient. a. Construct a scatterplot. Choose the correct graph below. O A. B. D Ay 10- AY 10- 8 лу 10- AY 10- 8- 8- 8- 6- 6- 6- 6-...
 O B. ??. (Round to tree decimal places as needed) a linear comelation between the two O A There is suficient evidence to support the claim of a linear comlaion between the two va-ables 0?. There is suflert eidence to support the clain ofanonrear O C. There is O D. There is insufficent evidence to support the claim of a inear comelation bertwean the tbwo variables evidence to support the claim of a nonlinear wo variables two variables O A....
 tound to 3 decimal places as needed pls
This Question: 1 pt 18 of 24 16 completo) This Test: 24 pts possible Use the given data set to complete parts (a) through (c) below. (Us 0.05) x 10 B 13 9 7.47 6.78 12.75 7.11 11 781 14 BR) 6 6.08 & 539 7 12 8.15 574 Click here to view a table of critical values for the correlation coefficient a. Construct a scatterplot. Choose the correct graph below OD...
tound to 3 decimal places as needed pls
This Question: 1 pt 18 of 24 16 completo) This Test: 24 pts possible Use the given data set to complete parts (a) through (c) below. (Us 0.05) x 10 B 13 9 7.47 6.78 12.75 7.11 11 781 14 BR) 6 6.08 & 539 7 12 8.15 574 Click here to view a table of critical values for the correlation coefficient a. Construct a scatterplot. Choose the correct graph below OD...
 Use the given data set to complete parts (a) through (c) below. (Use a = 0.05.) X 8 10 9.14 13 8.75 9 8.78 11 9.26 14 8.11 6 6.13 4 3.11 12 9.13 7 7.26 5 4.74 y 8.13 Click here to view a table of critical values for the correlation coefficient. a. Construct a scatterplot. Choose the correct graph below. OA. OB. OC. OD. AY 10 Ау 10- 8- AY 10- 8- 6- 4- 6- ......... 8- 6-...
Most questions answered within 3 hours.
-
3) What are the typical social structures in a global city?
asked 1 hour ago -
Luther Corporation
Consolidated Balance Sheet
December 31, 2019 and 2018 (in $ millions)
Assets
2019
2018...
asked 1 hour ago -
(Expected rate of return and risk) Carter Inc. is evaluating a
security. Calculate the investment’s expected...
asked 4 hours ago -
What specific indicators can point to lack of progress for
African Americans in American society?
asked 5 hours ago -
1-The Electrons in a beam are moving at 2.7×10⁸ m/s in an
electric field of 15000...
asked 5 hours ago -
A gas tank is a vertical cylinder. It has a radius of 1m, a
height of...
asked 6 hours ago -
Accent Software faces the following conditions. All of these
support Accent’s use of a market-penetration pricing...
asked 7 hours ago -
A mathematically inclined friend emails you the following
instructions: "Meet me in the cafeteria the first...
asked 7 hours ago -
A monopoly sells in two countries . The demand curves in the two
countries are p1...
asked 8 hours ago -
A .15kg rubber ball is bounced off a wall. Before hitting the
wall, the ball moves...
asked 8 hours ago -
A manufacturing company preparing to build a new plant is
considering three potential locations for it....
asked 8 hours ago -
B. If compound Y has approximately the same values of solubility
in toluene as compound X,...
asked 9 hours ago