
Homework Answers
Add Answer to:
so the given data set to complete parts (a) through (c) below. (Use q=0.06.) Question Help...
Use the given data set to complete parts (a) through (c) below. (Use a = 0.05.)...
 Use the given data set to complete parts (a) through (c) below. (Use a = 0.05.) X 8 10 9.14 13 8.75 9 8.78 11 9.26 14 8.11 6 6.13 4 3.11 12 9.13 7 7.26 5 4.74 y 8.13 Click here to view a table of critical values for the correlation coefficient. a. Construct a scatterplot. Choose the correct graph below. OA. OB. OC. OD. AY 10 Ау 10- 8- AY 10- 8- 6- 4- 6- ......... 8- 6-...
Use the given data set to complete parts (a) through (c) below. (Use a = 0.05.)...
 Use the given data set to complete parts (a) through (c) below. (Use a = 0.05.) x v 10 9.14 8 8.13 13 8.74 9 8.77 11 9.27 14 8.09 6 6.13 4 3.09 12 9.13 7 7.26 5 4.75 1 | 3 Click here to view a table of critical values for the correlation coefficient. a. Construct a scatterplot. Choose the correct graph below. O A. O toot'n'to * TAŚ 12 16 d's 12' 16' °C 8 12 16...
Use the given data set to complete parts (a) through (c) below. (Use a = 0.05.)...
 Use the given data set to complete parts (a) through (c) below. (Use a = 0.05.) X 10 9.15 8 8.15 13 8.74 9 8.78 11 9.26 14 8.11 6 6.14 4 3.09 12 9.13 7 7.26 5 4.73 y Click here to view a table of critical values for the correlation coefficient. 10 10- 10- 104 8- 8- 8- 8- . 6- 6- 6- 6- 4- 4- 4- 4- . 2- 2- 2- 2- х х 0 0- 0...
Use the given data set to complete parts (a) through (c) below. (Use a=0.05.) X: 10...
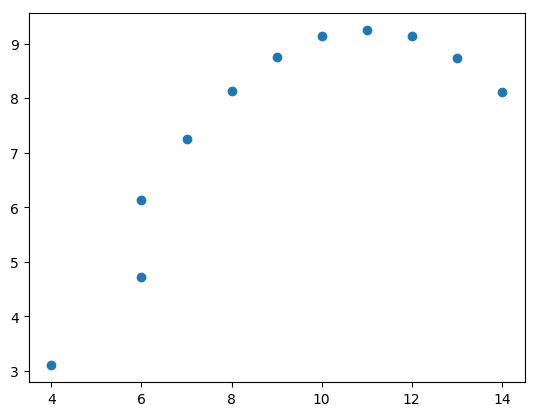
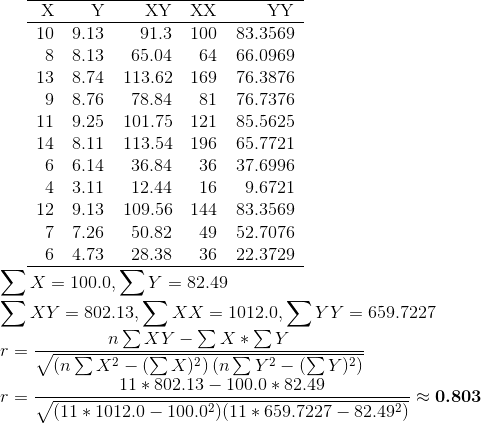
Use the given data set to complete parts (a) through (c) below. (Use a=0.05.) X: 10 8 13 9 11 14 6 4 12 7 5 Y: 9.14 8.15 8.74 8.78 9.26 8.11 6.13 3.11 9.13 7.26 4.74 The linear correlation coefficient is r= Determine whether there is sufficient evidence to support the claim of a linear correlation between two variables. Identify the feature of the data that would be missed if part b was completed with out the construction...
Use the given data set to complete parts (a) through (c) below. (Use a=0.05.) n х...
 Use the given data set to complete parts (a) through (c) below. (Use a=0.05.) n х 10 9.14 8 8.14 13 8.74 11 9.26 14 8.11 6 6.13 4 3.11 12 9.12 7 7.26 5 4.75 y 8.77 Click here to view a table of critical values for the correlation coefficient. a. Construct a scatterplot. Choose the correct graph below. O A. B. D Ay 10- AY 10- 8 лу 10- AY 10- 8- 8- 8- 6- 6- 6- 6-...
Use the given data set to complete parts (a) through (C) below. (Use a = 0.05.)...
 Use the given data set to complete parts (a) through (C) below. (Use a = 0.05.) 10 9.14 8 8.15 13 8.74 9 8.77 11 9.27 14 8.09 6 6.13 4 3.09 12 9.13 5 4.75 7.26 Click here to view a table of critical values for the correlation coefficient. a. Construct a scatterplot. Choose the correct graph below. OA OB. OC. OD. AY 10- 8 10- 10 8 10- 8- 6 6- 6- . 6- 4 4 4- 4...
Use the given data set to complete parts (a) through (c) below. (Use a = 0.05.)...
 Use the given data set to complete parts (a) through (c) below. (Use a = 0.05.) 5 х у 10 9.14 8 8.14 13 8.73 9 8.76 11 9.26 14 8.09 6 6.13 4 3.09 12 9.13 7 7.25 4.73 Click here to view a table of critical values for the correlation coefficient. a. Construct a scatterplot. Choose the correct graph below. OA. OB. O c. OD y AY 10- 8- Ay 10-1 a 10- 10- 8- 6- 8-1 8-...
nupul 10) 3 of 122 complete Save Score: 0 of 1 pt HW Score: 16.67%, 2...
 nupul 10) 3 of 122 complete Save Score: 0 of 1 pt HW Score: 16.67%, 2 of 12 p 10.2.9 Question Help Use the given data set to complete parts (a) through (c) below. (Use 0.05.) 10 9.13 8 8.13 13 8.74 9 8.76 11 9.25 14 8.11 6 6.16 4 3.11 12 7 726 473 Click here to view a table of critical values for the correlation coefficient a. Construct a scatterplot. Choose the correct graph below. OA oc...
Use the given data set to complete parts (a) through (c) below. (Use a-0.05.) 10 9.13...
 Use the given data set to complete parts (a) through (c) below. (Use a-0.05.) 10 9.13 13 8.75 12 9.13 3.11 4.74 8.14 8.77 9.25 8.09 6.13 7.25 Click here to view a table of critical values for the correlation coefficient. a. Construct a scatterplot. Choose the correct graph below. OA. OB. O C. OD. 12 16 12 16 8 12 16 12 16 b. Find the linear correlation coefficient, r, then determine whether there is sufficient evidence to support...
find critical values too please He! Use the given data set to complete parts (a) through...
 find critical values too please
He! Use the given data set to complete parts (a) through (c) below. (Use a = 0.05) 10 8 13 9.13 8 14 873 8.77 9.26 14 8.11 6 6.12 4 3.11 12 9.13 5 7.27 Click here to view a table of critical values for the correlation coefficient a. Construct a scatterplot Choose the correct graph below ОА. OB OC. OD Ay 10- Ay 10 A) AY 10 10 8 6 8 6 ***...
find critical values too please
He! Use the given data set to complete parts (a) through (c) below. (Use a = 0.05) 10 8 13 9.13 8 14 873 8.77 9.26 14 8.11 6 6.12 4 3.11 12 9.13 5 7.27 Click here to view a table of critical values for the correlation coefficient a. Construct a scatterplot Choose the correct graph below ОА. OB OC. OD Ay 10- Ay 10 A) AY 10 10 8 6 8 6 ***...
 Use the given data set to complete parts (a) through (c) below. (Use a = 0.05.) X 8 10 9.14 13 8.75 9 8.78 11 9.26 14 8.11 6 6.13 4 3.11 12 9.13 7 7.26 5 4.74 y 8.13 Click here to view a table of critical values for the correlation coefficient. a. Construct a scatterplot. Choose the correct graph below. OA. OB. OC. OD. AY 10 Ау 10- 8- AY 10- 8- 6- 4- 6- ......... 8- 6-...
 Use the given data set to complete parts (a) through (c) below. (Use a = 0.05.) x v 10 9.14 8 8.13 13 8.74 9 8.77 11 9.27 14 8.09 6 6.13 4 3.09 12 9.13 7 7.26 5 4.75 1 | 3 Click here to view a table of critical values for the correlation coefficient. a. Construct a scatterplot. Choose the correct graph below. O A. O toot'n'to * TAŚ 12 16 d's 12' 16' °C 8 12 16...
 Use the given data set to complete parts (a) through (c) below. (Use a = 0.05.) X 10 9.15 8 8.15 13 8.74 9 8.78 11 9.26 14 8.11 6 6.14 4 3.09 12 9.13 7 7.26 5 4.73 y Click here to view a table of critical values for the correlation coefficient. 10 10- 10- 104 8- 8- 8- 8- . 6- 6- 6- 6- 4- 4- 4- 4- . 2- 2- 2- 2- х х 0 0- 0...
 Use the given data set to complete parts (a) through (c) below. (Use a=0.05.) n х 10 9.14 8 8.14 13 8.74 11 9.26 14 8.11 6 6.13 4 3.11 12 9.12 7 7.26 5 4.75 y 8.77 Click here to view a table of critical values for the correlation coefficient. a. Construct a scatterplot. Choose the correct graph below. O A. B. D Ay 10- AY 10- 8 лу 10- AY 10- 8- 8- 8- 6- 6- 6- 6-...
 Use the given data set to complete parts (a) through (C) below. (Use a = 0.05.) 10 9.14 8 8.15 13 8.74 9 8.77 11 9.27 14 8.09 6 6.13 4 3.09 12 9.13 5 4.75 7.26 Click here to view a table of critical values for the correlation coefficient. a. Construct a scatterplot. Choose the correct graph below. OA OB. OC. OD. AY 10- 8 10- 10 8 10- 8- 6 6- 6- . 6- 4 4 4- 4...
 Use the given data set to complete parts (a) through (c) below. (Use a = 0.05.) 5 х у 10 9.14 8 8.14 13 8.73 9 8.76 11 9.26 14 8.09 6 6.13 4 3.09 12 9.13 7 7.25 4.73 Click here to view a table of critical values for the correlation coefficient. a. Construct a scatterplot. Choose the correct graph below. OA. OB. O c. OD y AY 10- 8- Ay 10-1 a 10- 10- 8- 6- 8-1 8-...
 nupul 10) 3 of 122 complete Save Score: 0 of 1 pt HW Score: 16.67%, 2 of 12 p 10.2.9 Question Help Use the given data set to complete parts (a) through (c) below. (Use 0.05.) 10 9.13 8 8.13 13 8.74 9 8.76 11 9.25 14 8.11 6 6.16 4 3.11 12 7 726 473 Click here to view a table of critical values for the correlation coefficient a. Construct a scatterplot. Choose the correct graph below. OA oc...
 Use the given data set to complete parts (a) through (c) below. (Use a-0.05.) 10 9.13 13 8.75 12 9.13 3.11 4.74 8.14 8.77 9.25 8.09 6.13 7.25 Click here to view a table of critical values for the correlation coefficient. a. Construct a scatterplot. Choose the correct graph below. OA. OB. O C. OD. 12 16 12 16 8 12 16 12 16 b. Find the linear correlation coefficient, r, then determine whether there is sufficient evidence to support...
 find critical values too please
He! Use the given data set to complete parts (a) through (c) below. (Use a = 0.05) 10 8 13 9.13 8 14 873 8.77 9.26 14 8.11 6 6.12 4 3.11 12 9.13 5 7.27 Click here to view a table of critical values for the correlation coefficient a. Construct a scatterplot Choose the correct graph below ОА. OB OC. OD Ay 10- Ay 10 A) AY 10 10 8 6 8 6 ***...
find critical values too please
He! Use the given data set to complete parts (a) through (c) below. (Use a = 0.05) 10 8 13 9.13 8 14 873 8.77 9.26 14 8.11 6 6.12 4 3.11 12 9.13 5 7.27 Click here to view a table of critical values for the correlation coefficient a. Construct a scatterplot Choose the correct graph below ОА. OB OC. OD Ay 10- Ay 10 A) AY 10 10 8 6 8 6 ***...
Most questions answered within 3 hours.
-
Write a program to solve the Josephus problem, with the following
modification:
Sample Input:
./a.out n...
asked 1 hour ago -
At the start of a CD it is spinning at a rate of 525 rpm
(revolutions...
asked 2 hours ago -
4. Without doing any calculations, predict whether the observed
∆T would increase, decrease or remain the...
asked 3 hours ago -
Based on the range, which of the following sets of scores has
the greatest variability? 3,...
asked 4 hours ago -
Ripples in a pond travel at a velocity of 3 m/s with one peak
passing a...
asked 4 hours ago -
A man stands on the roof of a building of height 13.0 mm and
throws a...
asked 4 hours ago -
The extent to which assets are financed by borrowed funds and
other liabilities is indicated by:...
asked 5 hours ago -
Explain in detail
Germany is the fifth largest economy
explain what goods and services Germany specializes...
asked 5 hours ago -
The density of platinum is 21.45 g/mL. If a cube of platinum
with a mass of...
asked 5 hours ago -
Accounts Receivable
Sales
A/R Posting
Extended Sales Invoice
Packing Slip
Compare invoice to packing slip 2...
asked 5 hours ago -
Michaella, age 23, is a full-time law student and is claimed by
her parents as a...
asked 5 hours ago -
Why are polymers not typically casted into products?
asked 6 hours ago