
Homework Answers

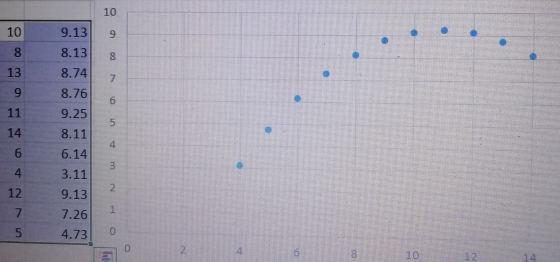
I have attached the image of scatter plot drawn using excel.
From the above image, it is clearly seen that option a is correct.
I have attached the image of scatter plot drawn using excel.
From the above image, it is clearly seen that option a is correct.
Hope this helps you !!!
Add Answer to:
nupul 10) 3 of 122 complete Save Score: 0 of 1 pt HW Score: 16.67%, 2...
so the given data set to complete parts (a) through (c) below. (Use q=0.06.) Question Help...
 so the given data set to complete parts (a) through (c) below. (Use q=0.06.) Question Help x у 10 9.13 8 8.13 13 8.74 9 8.76 11 925 14 8.11 6 6.14 4 3.11 12 9.13 7 7.26 473 Click here to view a table of critical values for the correlation coefficient. a. Construct a scatterplot. Choose the correct graph below. A OB Ос. OD Ay 10 @ 10 8 10 A 5 ******** 4 Ау 10 8 6 4...
Use the given data set to complete parts (a) through (c) below. (Use a = 0.05.)...
 Use the given data set to complete parts (a) through (c) below. (Use a = 0.05.) X 8 10 9.14 13 8.75 9 8.78 11 9.26 14 8.11 6 6.13 4 3.11 12 9.13 7 7.26 5 4.74 y 8.13 Click here to view a table of critical values for the correlation coefficient. a. Construct a scatterplot. Choose the correct graph below. OA. OB. OC. OD. AY 10 Ау 10- 8- AY 10- 8- 6- 4- 6- ......... 8- 6-...
find critical values too please He! Use the given data set to complete parts (a) through...
 find critical values too please
He! Use the given data set to complete parts (a) through (c) below. (Use a = 0.05) 10 8 13 9.13 8 14 873 8.77 9.26 14 8.11 6 6.12 4 3.11 12 9.13 5 7.27 Click here to view a table of critical values for the correlation coefficient a. Construct a scatterplot Choose the correct graph below ОА. OB OC. OD Ay 10- Ay 10 A) AY 10 10 8 6 8 6 ***...
find critical values too please
He! Use the given data set to complete parts (a) through (c) below. (Use a = 0.05) 10 8 13 9.13 8 14 873 8.77 9.26 14 8.11 6 6.12 4 3.11 12 9.13 5 7.27 Click here to view a table of critical values for the correlation coefficient a. Construct a scatterplot Choose the correct graph below ОА. OB OC. OD Ay 10- Ay 10 A) AY 10 10 8 6 8 6 ***...
Use the given data set to complete parts (a) through (c) below. (Use a=0.05.) X: 10...
Use the given data set to complete parts (a) through (c) below. (Use a=0.05.) X: 10 8 13 9 11 14 6 4 12 7 5 Y: 9.14 8.15 8.74 8.78 9.26 8.11 6.13 3.11 9.13 7.26 4.74 The linear correlation coefficient is r= Determine whether there is sufficient evidence to support the claim of a linear correlation between two variables. Identify the feature of the data that would be missed if part b was completed with out the construction...
Score: 0 of 1 pt 2 of 10 (0 complete) HW Score: 13.1.13 Questi Create a...
 Score: 0 of 1 pt 2 of 10 (0 complete) HW Score: 13.1.13 Questi Create a graph with six vertices and exactly three bridges. Which of the following graphs has six vertices and exactly three bridges? OA ОВ. Ос. Det q Jef Click to select your answer and then click Check Answer
Save Score: 0 of 1 pt 8 of 9 (3 complete) HW Score: 22.22 % ,...
 Save Score: 0 of 1 pt 8 of 9 (3 complete) HW Score: 22.22 % , 2 of 9 pts P 5-38 (similar to) Question Help What is the shape of the yield curve given in the following term structure? What expectations are investors ikely to have about future interest rates? Term 2 years 10 years 20 years 1 уear 1.96 З уears 2.74 5 years 3.34 7 years Rate (EAR, %) 244 3.76 414 4 92 What is the...
Use the given data set to complete parts (a) through (c) below. (Use a=0.05.) n х...
 Use the given data set to complete parts (a) through (c) below. (Use a=0.05.) n х 10 9.14 8 8.14 13 8.74 11 9.26 14 8.11 6 6.13 4 3.11 12 9.12 7 7.26 5 4.75 y 8.77 Click here to view a table of critical values for the correlation coefficient. a. Construct a scatterplot. Choose the correct graph below. O A. B. D Ay 10- AY 10- 8 лу 10- AY 10- 8- 8- 8- 6- 6- 6- 6-...
Use the given data set to complete parts (a) through (c) below. (Use a = 0.05.)...
 Use the given data set to complete parts (a) through (c) below. (Use a = 0.05.) x v 10 9.14 8 8.13 13 8.74 9 8.77 11 9.27 14 8.09 6 6.13 4 3.09 12 9.13 7 7.26 5 4.75 1 | 3 Click here to view a table of critical values for the correlation coefficient. a. Construct a scatterplot. Choose the correct graph below. O A. O toot'n'to * TAŚ 12 16 d's 12' 16' °C 8 12 16...
Save Homework: Homework: 10.1 Correlation Score: 0 of 1 pt 4 Il of 11 ( complete)...
 Save Homework: Homework: 10.1 Correlation Score: 0 of 1 pt 4 Il of 11 ( complete) HW Score: 59.74% 6 57 of 11 pts Question Helo Instructor-created question Listed below are the brain volumes (in cm) of twins and the corresponding 1 score. Construct a scatterplot find the value of the linear correlation coeficient, and find the P-value using 0.05. Is there sufficient evidence to conclude that there is a linea correlation between brain volume and IQ scores? Full Data...
Use the given data set to complete parts (a) through (c) below. (Use a-0.05.) 10 9.13...
 Use the given data set to complete parts (a) through (c) below. (Use a-0.05.) 10 9.13 13 8.75 12 9.13 3.11 4.74 8.14 8.77 9.25 8.09 6.13 7.25 Click here to view a table of critical values for the correlation coefficient. a. Construct a scatterplot. Choose the correct graph below. OA. OB. O C. OD. 12 16 12 16 8 12 16 12 16 b. Find the linear correlation coefficient, r, then determine whether there is sufficient evidence to support...
 so the given data set to complete parts (a) through (c) below. (Use q=0.06.) Question Help x у 10 9.13 8 8.13 13 8.74 9 8.76 11 925 14 8.11 6 6.14 4 3.11 12 9.13 7 7.26 473 Click here to view a table of critical values for the correlation coefficient. a. Construct a scatterplot. Choose the correct graph below. A OB Ос. OD Ay 10 @ 10 8 10 A 5 ******** 4 Ау 10 8 6 4...
 Use the given data set to complete parts (a) through (c) below. (Use a = 0.05.) X 8 10 9.14 13 8.75 9 8.78 11 9.26 14 8.11 6 6.13 4 3.11 12 9.13 7 7.26 5 4.74 y 8.13 Click here to view a table of critical values for the correlation coefficient. a. Construct a scatterplot. Choose the correct graph below. OA. OB. OC. OD. AY 10 Ау 10- 8- AY 10- 8- 6- 4- 6- ......... 8- 6-...
 find critical values too please
He! Use the given data set to complete parts (a) through (c) below. (Use a = 0.05) 10 8 13 9.13 8 14 873 8.77 9.26 14 8.11 6 6.12 4 3.11 12 9.13 5 7.27 Click here to view a table of critical values for the correlation coefficient a. Construct a scatterplot Choose the correct graph below ОА. OB OC. OD Ay 10- Ay 10 A) AY 10 10 8 6 8 6 ***...
find critical values too please
He! Use the given data set to complete parts (a) through (c) below. (Use a = 0.05) 10 8 13 9.13 8 14 873 8.77 9.26 14 8.11 6 6.12 4 3.11 12 9.13 5 7.27 Click here to view a table of critical values for the correlation coefficient a. Construct a scatterplot Choose the correct graph below ОА. OB OC. OD Ay 10- Ay 10 A) AY 10 10 8 6 8 6 ***...
 Score: 0 of 1 pt 2 of 10 (0 complete) HW Score: 13.1.13 Questi Create a graph with six vertices and exactly three bridges. Which of the following graphs has six vertices and exactly three bridges? OA ОВ. Ос. Det q Jef Click to select your answer and then click Check Answer
 Save Score: 0 of 1 pt 8 of 9 (3 complete) HW Score: 22.22 % , 2 of 9 pts P 5-38 (similar to) Question Help What is the shape of the yield curve given in the following term structure? What expectations are investors ikely to have about future interest rates? Term 2 years 10 years 20 years 1 уear 1.96 З уears 2.74 5 years 3.34 7 years Rate (EAR, %) 244 3.76 414 4 92 What is the...
 Use the given data set to complete parts (a) through (c) below. (Use a=0.05.) n х 10 9.14 8 8.14 13 8.74 11 9.26 14 8.11 6 6.13 4 3.11 12 9.12 7 7.26 5 4.75 y 8.77 Click here to view a table of critical values for the correlation coefficient. a. Construct a scatterplot. Choose the correct graph below. O A. B. D Ay 10- AY 10- 8 лу 10- AY 10- 8- 8- 8- 6- 6- 6- 6-...
 Use the given data set to complete parts (a) through (c) below. (Use a = 0.05.) x v 10 9.14 8 8.13 13 8.74 9 8.77 11 9.27 14 8.09 6 6.13 4 3.09 12 9.13 7 7.26 5 4.75 1 | 3 Click here to view a table of critical values for the correlation coefficient. a. Construct a scatterplot. Choose the correct graph below. O A. O toot'n'to * TAŚ 12 16 d's 12' 16' °C 8 12 16...
 Save Homework: Homework: 10.1 Correlation Score: 0 of 1 pt 4 Il of 11 ( complete) HW Score: 59.74% 6 57 of 11 pts Question Helo Instructor-created question Listed below are the brain volumes (in cm) of twins and the corresponding 1 score. Construct a scatterplot find the value of the linear correlation coeficient, and find the P-value using 0.05. Is there sufficient evidence to conclude that there is a linea correlation between brain volume and IQ scores? Full Data...
 Use the given data set to complete parts (a) through (c) below. (Use a-0.05.) 10 9.13 13 8.75 12 9.13 3.11 4.74 8.14 8.77 9.25 8.09 6.13 7.25 Click here to view a table of critical values for the correlation coefficient. a. Construct a scatterplot. Choose the correct graph below. OA. OB. O C. OD. 12 16 12 16 8 12 16 12 16 b. Find the linear correlation coefficient, r, then determine whether there is sufficient evidence to support...
Most questions answered within 3 hours.
-
Find the mixed-strategy equilibrium to the Battle of the sexes
game in Figure 5.1 below
Hockey...
asked 3 minutes ago -
At 1 bar, how much energy is required to heat 61.0 g of H2O(s)
at −12.0...
asked 1 minute ago -
Use the following information to answer the next three
questions.
QUESTION 5
As of today, the...
asked 9 minutes ago -
Using the specific identification method: Date Units purchased
Cost per unit Ending inventory March 1 15...
asked 11 minutes ago -
PLEASE HELP, NO ONE IS ANSWERING MY QUESTION AND IT IS SUE TODAY
WORTH 20% OF...
asked 26 minutes ago -
α = 0.0007889 T, I = 2.9 A
Other Magnetic Fields: First, based on your
value...
asked 25 minutes ago -
This assignment is a continuation of the 2nd one. You as a HR
Manager, select an...
asked 27 minutes ago -
Hastings Entertainment has a beta of 0.64. If the market return
is expected to be 13.80...
asked 39 minutes ago -
9. Depository institutions are always:
a. illiquid
b. profitable
c. insolvent
d. all of the above...
asked 47 minutes ago -
Use AstroTurf Company's income statement below to answer the
following two questions. Answer these questions with...
asked 47 minutes ago -
How is a firm's task
environment different from its general environment? Provide
examples of both types...
asked 45 minutes ago -
What is one reason Innovators can adopt innovations so
early?
Group of answer choices
they are...
asked 47 minutes ago