![11. [-13.22 Points] DETAILS LARLINALG8 2.6.017. Consider the following. 5 (1,5) 4 (2, 4) 3 2 (2, 2) (3, 1) - Х - 1 2 3 4 -14](http://img.homeworklib.com/questions/8c08a700-e347-11ea-8ea3-d1d6344ce866.png?x-oss-process=image/resize,w_560) (a)
Sketch the line that appears to be the best fit for the given
points.
(a)
Sketch the line that appears to be the best fit for the given
points.
(b) Find the least squares regression line. y(x)=
(c) Calculate the sum of squared error.
Homework Answers
(a)
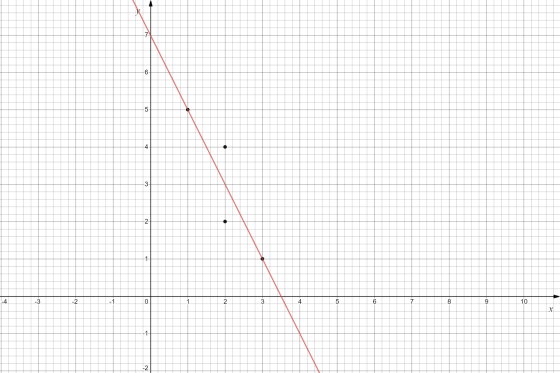
The figure below illustrates a scatter plot and a line of best fit.
The equation of the line is,  , where m is the slope of the line, and c is the y-intercept.
The line passes through the points, A(1,5), and, B(3,1).
Slope, m=
i.e., m=-2
Therefore the equation of the line becomes, y=-2x+c
The above line passes through the point, A(1,5). Using the co-ordinates of the point A(1,5), in the above, equation of the line, we have,
5=(-2)(1)+c
i.e., c=7
Substituting the value of, c=7 in the above, equation of the line, we have, the equation of the line,

The equation of the line of best fit, is,
.
(b)
The least squares regression line is given by the formula,
 ,
,
Its slope  and y-intercept
  are computed using the formulas,
  , and,
  , where,
 ,
,

 is the mean of all the x-values,
  is the mean of all the y-values, and n is the number of pairs in
the data set.
is the mean of all the y-values, and n is the number of pairs in
the data set.
| x | y | x^2 | xy | |
| 1 | 5 | 1 | 5 | |
| 2 | 2 | 4 | 4 | |
| 2 | 4 | 4 | 8 | |
| 3 | 1 | 9 | 3 | |
 |
8 | 12 | 18 | 20 |
In the last line of the table above, we have the sum of the numbers in each column. Using them we compute:


and we now have,

Using the value of  ,
,  , and,
  in the equation of the least squares regression line, we have,

We now have the least squares regression line for given data and
it is, 
(c)
We now calculate the sum of squared error.

 |
 |
 |
 |
|
| 1 | 5 | -1 | 1 | |
| 2 | 2 | 0 | 0 | |
| 2 | 4 | 0 | 0 | |
| 3 | 1 | 1 | 1 | |
|
8 | 12 | 0 | 2 |

i.e., 
i.e., 
i.e., 
Add Answer to:
(a)
Sketch the line that appears to be the best fit for the given
points.
(b)...
Consider the following. у 6 FO, 5) 4 (1,4) 3 (1, 2) .(2, 1) - 1...
 Consider the following. у 6 FO, 5) 4 (1,4) 3 (1, 2) .(2, 1) - 1 2 3 (a) Sketch the line that appears to be the best fit for the given points. у 6 6 (0,5) (0.5) (1, 4) *(1,4) 3 3 2(1, 2) 2/(1, 2) (2, 1) (2, 1) 1 2 3 2 No, 5) (0,5) (1, 4) (1,4) 3 3 21, 2) 2(1, 2) 1(2, 1) (2, 1) 1 - 1 1 2 3 -1 2 -14...
6. Start with the three points (a) Find the least squares line through the points. (b) Find the best curve of the form. I, C + D2r through the points. (c) Sketch the points, the least squares lin...
 6. Start with the three points (a) Find the least squares line through the points. (b) Find the best curve of the form. I, C + D2r through the points. (c) Sketch the points, the least squares line, and the curve you found in part graph. Which gives a better fit, the line or the curve? (b) on the same
6. Start with the three points (a) Find the least squares line through the points. (b) Find the best curve...
6. Start with the three points (a) Find the least squares line through the points. (b) Find the best curve of the form. I, C + D2r through the points. (c) Sketch the points, the least squares line, and the curve you found in part graph. Which gives a better fit, the line or the curve? (b) on the same
6. Start with the three points (a) Find the least squares line through the points. (b) Find the best curve...
Projections and Least Squares 3. Consider the points P (0,0), (1,8),(2,8),(3,20)) in R2, For each of the given function types f(x) below, . Find values for A, B, C that give the least squares fit to...
 Projections and Least Squares
3. Consider the points P (0,0), (1,8),(2,8),(3,20)) in R2, For each of the given function types f(x) below, . Find values for A, B, C that give the least squares fit to the set of points P . Graph your solution along with P (feel free to graph all functions on the same graph). . Compute sum of squares error ((O) -0)2((1) 8)2 (f(2) -8)2+ (f(3) - 20)2 for the least squares fit you found (a)...
Projections and Least Squares
3. Consider the points P (0,0), (1,8),(2,8),(3,20)) in R2, For each of the given function types f(x) below, . Find values for A, B, C that give the least squares fit to the set of points P . Graph your solution along with P (feel free to graph all functions on the same graph). . Compute sum of squares error ((O) -0)2((1) 8)2 (f(2) -8)2+ (f(3) - 20)2 for the least squares fit you found (a)...
Find the least squares regression line. (0, 0), (1, 1), (2, 7) y(x) = Need Help?...
 Find the least squares regression line. (0, 0), (1, 1), (2, 7) y(x) = Need Help? Read It Watch It Talk to a Tutor Submit Answer /1 Points] DETAILS LARLINALG8 2.6.025. Find the least squares regression line. (-1, 10), (1, 9), (3, 7), (7,4), (5,5) y(x) =
Drop down options for Part (h) are: (d) or (b) 3 of 6 (6 complete) This Question: 1 pt This Quiz: 6 pts possible Questio...
 down options for Part (h) are: (d) or (b)Complete parts (a) through (h) for the data below. x2030405060y7975706250 (b) Find the equation of the line containing the points (30,75) and (60,50). (c) Graph the line found in part (b) the scatter diagram. Choose the correct graph below. (d) By hand, determine the least-squares regression line. (e) Graph the least-squares regression line on the scatter diagram. (f) Compute the sum of the squared residuals for the line found in part (b) (g) Compute the sum of the squared...
Question 3 1 pts Select the best statement related to the estimation of the least squares...
 Question 3 1 pts Select the best statement related to the estimation of the least squares regression line O The least squares regression intercept and slope is determined based on the optimal combination which will minimize the sum of absolute horizontal distances between the observations and the regression line O The least squares regression intercept and slope is determined based on the optimal combination which will minimize the sum of squared vertical distances between the observations and the regression line....
Consider the measurement data given in the following table. k 1 2 3 xk 1 3...
Consider the measurement data given in the following table. k 1 2 3 xk 1 3 5 yk 2 1.8 1 Determine the least squares estimates α and β of the parameters of the regression line y = α + βx Determine all residuals rk and check that they add up to 0. Determine the value of least squares error, the sum of all squared residuals rk. Draw in one figure the scatterplot of the data and the estimated regression...
In the United States, tyre tread depth is measured in 32nds of an inch. Car tyres typically start out with 10/32 to 11/32 of an inch of tread depth. In most states, a tyre is legally worn out when...
 In the United States, tyre tread depth is measured in 32nds of an inch. Car tyres typically start out with 10/32 to 11/32 of an inch of tread depth. In most states, a tyre is legally worn out when its tread depth reaches 2/32 of an inch. A random sample of four tyres provides the following data on distance driven and tread depth: Distance driven Tread Depth (32nds of an inch) Tyre (10,000 kilometres) 2 3 4 4 4 4...
FITTING A STRAIGHT LINE 1-6 Fit a straight line to the given points (x, y) by...
 FITTING A STRAIGHT LINE 1-6 Fit a straight line to the given points (x, y) by least squares. Using MATLAB 5. Average speed. Estimate the average speed vav of a car traveling according to s v - t [km] (s = distance traveled, [hr]time) from (t, s)= (9,140), (10,220) (11, 310), (12, 410).
FITTING A STRAIGHT LINE 1-6 Fit a straight line to the given points (x, y) by least squares. Using MATLAB 5. Average speed. Estimate the average speed...
FITTING A STRAIGHT LINE 1-6 Fit a straight line to the given points (x, y) by least squares. Using MATLAB 5. Average speed. Estimate the average speed vav of a car traveling according to s v - t [km] (s = distance traveled, [hr]time) from (t, s)= (9,140), (10,220) (11, 310), (12, 410).
FITTING A STRAIGHT LINE 1-6 Fit a straight line to the given points (x, y) by least squares. Using MATLAB 5. Average speed. Estimate the average speed...
 Consider the following. у 6 FO, 5) 4 (1,4) 3 (1, 2) .(2, 1) - 1 2 3 (a) Sketch the line that appears to be the best fit for the given points. у 6 6 (0,5) (0.5) (1, 4) *(1,4) 3 3 2(1, 2) 2/(1, 2) (2, 1) (2, 1) 1 2 3 2 No, 5) (0,5) (1, 4) (1,4) 3 3 21, 2) 2(1, 2) 1(2, 1) (2, 1) 1 - 1 1 2 3 -1 2 -14...
 6. Start with the three points (a) Find the least squares line through the points. (b) Find the best curve of the form. I, C + D2r through the points. (c) Sketch the points, the least squares line, and the curve you found in part graph. Which gives a better fit, the line or the curve? (b) on the same
6. Start with the three points (a) Find the least squares line through the points. (b) Find the best curve...
6. Start with the three points (a) Find the least squares line through the points. (b) Find the best curve of the form. I, C + D2r through the points. (c) Sketch the points, the least squares line, and the curve you found in part graph. Which gives a better fit, the line or the curve? (b) on the same
6. Start with the three points (a) Find the least squares line through the points. (b) Find the best curve...
 Projections and Least Squares
3. Consider the points P (0,0), (1,8),(2,8),(3,20)) in R2, For each of the given function types f(x) below, . Find values for A, B, C that give the least squares fit to the set of points P . Graph your solution along with P (feel free to graph all functions on the same graph). . Compute sum of squares error ((O) -0)2((1) 8)2 (f(2) -8)2+ (f(3) - 20)2 for the least squares fit you found (a)...
Projections and Least Squares
3. Consider the points P (0,0), (1,8),(2,8),(3,20)) in R2, For each of the given function types f(x) below, . Find values for A, B, C that give the least squares fit to the set of points P . Graph your solution along with P (feel free to graph all functions on the same graph). . Compute sum of squares error ((O) -0)2((1) 8)2 (f(2) -8)2+ (f(3) - 20)2 for the least squares fit you found (a)...
 Find the least squares regression line. (0, 0), (1, 1), (2, 7) y(x) = Need Help? Read It Watch It Talk to a Tutor Submit Answer /1 Points] DETAILS LARLINALG8 2.6.025. Find the least squares regression line. (-1, 10), (1, 9), (3, 7), (7,4), (5,5) y(x) =
 down options for Part (h) are: (d) or (b)Complete parts (a) through (h) for the data below. x2030405060y7975706250 (b) Find the equation of the line containing the points (30,75) and (60,50). (c) Graph the line found in part (b) the scatter diagram. Choose the correct graph below. (d) By hand, determine the least-squares regression line. (e) Graph the least-squares regression line on the scatter diagram. (f) Compute the sum of the squared residuals for the line found in part (b) (g) Compute the sum of the squared...
 Question 3 1 pts Select the best statement related to the estimation of the least squares regression line O The least squares regression intercept and slope is determined based on the optimal combination which will minimize the sum of absolute horizontal distances between the observations and the regression line O The least squares regression intercept and slope is determined based on the optimal combination which will minimize the sum of squared vertical distances between the observations and the regression line....
 In the United States, tyre tread depth is measured in 32nds of an inch. Car tyres typically start out with 10/32 to 11/32 of an inch of tread depth. In most states, a tyre is legally worn out when its tread depth reaches 2/32 of an inch. A random sample of four tyres provides the following data on distance driven and tread depth: Distance driven Tread Depth (32nds of an inch) Tyre (10,000 kilometres) 2 3 4 4 4 4...
 FITTING A STRAIGHT LINE 1-6 Fit a straight line to the given points (x, y) by least squares. Using MATLAB 5. Average speed. Estimate the average speed vav of a car traveling according to s v - t [km] (s = distance traveled, [hr]time) from (t, s)= (9,140), (10,220) (11, 310), (12, 410).
FITTING A STRAIGHT LINE 1-6 Fit a straight line to the given points (x, y) by least squares. Using MATLAB 5. Average speed. Estimate the average speed...
FITTING A STRAIGHT LINE 1-6 Fit a straight line to the given points (x, y) by least squares. Using MATLAB 5. Average speed. Estimate the average speed vav of a car traveling according to s v - t [km] (s = distance traveled, [hr]time) from (t, s)= (9,140), (10,220) (11, 310), (12, 410).
FITTING A STRAIGHT LINE 1-6 Fit a straight line to the given points (x, y) by least squares. Using MATLAB 5. Average speed. Estimate the average speed...
Most questions answered within 3 hours.
-
Assume memory access is 10 units of time and disk access is
10000 units of time....
asked 10 minutes ago -
1. Are all good samples random?
2. Magazines often report surveys giving statistics such as “63%...
asked 32 minutes ago -
Under all the various types of market structures, firms
must eventually earn some economic profits for...
asked 18 minutes ago -
Consider the following fitness regime for a single locus trait
with two co-dominant alleles: w11 =...
asked 23 minutes ago -
A large cable company reports the following.
80% of its customers subscribe to its cable TV...
asked 38 minutes ago -
Please answer the question in brief.
Discuss the role of ERP in organizations. Are ERP tools...
asked 24 minutes ago -
Discuss the pros and cons of collaborative software such
as SameTime. Does it increase productivity? What...
asked 37 minutes ago -
Buying your in-laws a gift because it’s expected is
due to the ____________ motive of gift-giving....
asked 40 minutes ago -
Calculate the expected value, the variance, and the standard
deviation of the given random variable X....
asked 1 hour ago -
A hospital performs 100 surgeries per week. The probability that
complications after surgery occur is 10%....
asked 1 hour ago -
1 point) Given the significance level α=0.01 find the following:
(a) left-tailed z value z= (b)...
asked 1 hour ago -
Assuming you are the head of the software development unit at
Cyber.Soft, explain and justify why...
asked 47 minutes ago