
Homework Answers
![D F 21. 22+12+2 -13o 「3 규 42 구의 구2] 구3 ㄧ厂21-2]厂30 132 2. (e) Fon line 20 tim)守(S2-20 Evan 보 eten](http://img.homeworklib.com/images/26512881-e6eb-4fb6-aded-e7c85d3ce289.png?x-oss-process=image/resize,w_560) Matlab Code
Matlab Code
x=-5:0.1:5;
y=-10*x+20;
plot(x,y,'r')
hold on
x=-5:0.1:5;
y=24-6*2.^x;
plot(x,y,'b')
plot(0,22,'g*',1,6,'m*',2,2,'k*')
Output
Add Answer to:
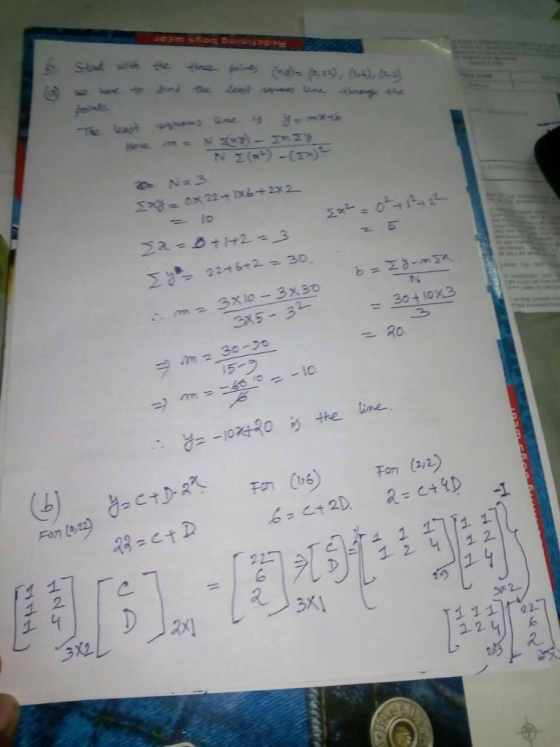
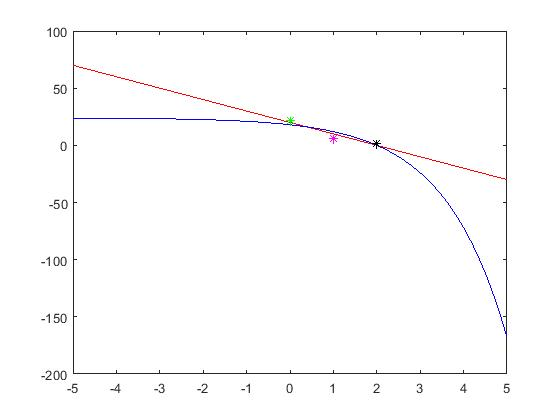
6. Start with the three points (a) Find the least squares line through the points. (b) Find the best curve of the form. I, C + D2r through the points. (c) Sketch the points, the least squares lin...
2. This problem finds the curve C ++D = b which gives the best least squares...
 2. This problem finds the curve C ++D = b which gives the best least squares fit to the points: t= -2, b=0 t = -1, b=0 t= 0, b=1 t= 1, b=1 t= 2, b=1 (a) (10 points) Write down the 5 equations Ax = b that would be satisfied if the curve went through all 5 points. (b) (10 points) Find the least squares solution = (Ĉ, Ð). (c) (10 points) Find the projection p of b onto...
Projections and Least Squares 3. Consider the points P (0,0), (1,8),(2,8),(3,20)) in R2, For each of the given function types f(x) below, . Find values for A, B, C that give the least squares fit to...
 Projections and Least Squares
3. Consider the points P (0,0), (1,8),(2,8),(3,20)) in R2, For each of the given function types f(x) below, . Find values for A, B, C that give the least squares fit to the set of points P . Graph your solution along with P (feel free to graph all functions on the same graph). . Compute sum of squares error ((O) -0)2((1) 8)2 (f(2) -8)2+ (f(3) - 20)2 for the least squares fit you found (a)...
Projections and Least Squares
3. Consider the points P (0,0), (1,8),(2,8),(3,20)) in R2, For each of the given function types f(x) below, . Find values for A, B, C that give the least squares fit to the set of points P . Graph your solution along with P (feel free to graph all functions on the same graph). . Compute sum of squares error ((O) -0)2((1) 8)2 (f(2) -8)2+ (f(3) - 20)2 for the least squares fit you found (a)...
(a) Sketch the line that appears to be the best fit for the given points. (b)...
 (a)
Sketch the line that appears to be the best fit for the given
points.
(b) Find the least squares regression line. y(x)=
(c) Calculate the sum of squared error.
11. [-13.22 Points] DETAILS LARLINALG8 2.6.017. Consider the following. 5 (1,5) 4 (2, 4) 3 2 (2, 2) (3, 1) - Х - 1 2 3 4 -14 (a) Sketch the line that appears to be the best fit for the given points.
(a)
Sketch the line that appears to be the best fit for the given
points.
(b) Find the least squares regression line. y(x)=
(c) Calculate the sum of squared error.
11. [-13.22 Points] DETAILS LARLINALG8 2.6.017. Consider the following. 5 (1,5) 4 (2, 4) 3 2 (2, 2) (3, 1) - Х - 1 2 3 4 -14 (a) Sketch the line that appears to be the best fit for the given points.
(1 point) Find the least-squares regression line ý = b + b 2 through the points...
 (1 point) Find the least-squares regression line ý = b + b 2 through the points (-2,0), (1,7), (6, 15), (7, 20), (9, 24). For what value of I is ŷ = 0?
Find the equation y = Bo + B,x of the least-squares line that best fits the...
 Find the equation y = Bo + B,x of the least-squares line that best fits the given data points. (1,1), (2,1), (3,2), (4,2) The line is y=+x. (Type integers or decimals.) Find the equation y = B.+Byx of the least-squares line that best fits the given data points. (5,6), (6,4), (8,2), (9,0) The line is y=+x. (Type integers or decimals.) Find the equation y = Be + Box of the least-squares line that best fits the given data points. (-1,0),...
only (c) please Find the least squares fit to the data x0 12 (a) By a linear function. Plot your linear function along with the data on a coordinate system. (b) By a quadratic polynomial. Sketch the...
 only (c) please
Find the least squares fit to the data x0 12 (a) By a linear function. Plot your linear function along with the data on a coordinate system. (b) By a quadratic polynomial. Sketch the graph. c) By a function of the form ya2 b2*. 2-1
Find the least squares fit to the data x0 12 (a) By a linear function. Plot your linear function along with the data on a coordinate system. (b) By a quadratic polynomial....
only (c) please
Find the least squares fit to the data x0 12 (a) By a linear function. Plot your linear function along with the data on a coordinate system. (b) By a quadratic polynomial. Sketch the graph. c) By a function of the form ya2 b2*. 2-1
Find the least squares fit to the data x0 12 (a) By a linear function. Plot your linear function along with the data on a coordinate system. (b) By a quadratic polynomial....
(2 points) Find the least squares regression line ý = b + b through the points...
 (2 points) Find the least squares regression line ý = b + b through the points (-2,0), (2,9), (5,15), (7,20),(10,26). For what value of cis y = 0? =
6. This problem uses least squares to find the curve y=ax+bx2 that best fits these 4...
This problem uses least squares to find the curve \(y=a x+b x^{2}\) that best fits these 4 points in the plane:$$ \left(x_{1}, y_{1}\right)=(-2,2), \quad\left(x_{2}, y_{2}\right)=(-1,1), \quad\left(x_{1}, y_{3}\right)=(1,0), \quad\left(x_{4}, y_{4}\right)=(2,2) . $$a. Write down 4 equations \(a x_{i}+b x_{i}^{2}=y_{i}, i=1,2,3,4\), that would be true if the line actually went through a11 four points.b. Now write those four equations in the form \(\mathbf{A}\left[\begin{array}{l}a \\ b\end{array}\right]=\mathbf{y}\)c. Now find \(\left[\begin{array}{l}\hat{a} \\ \hat{b}\end{array}\right]\) that minimizes \(\left\|A\left[\begin{array}{l}a \\ b\end{array}\right]-\mathbf{y}\right\|^{2}\).
Drop down options for Part (h) are: (d) or (b) 3 of 6 (6 complete) This Question: 1 pt This Quiz: 6 pts possible Questio...
 down options for Part (h) are: (d) or (b)Complete parts (a) through (h) for the data below. x2030405060y7975706250 (b) Find the equation of the line containing the points (30,75) and (60,50). (c) Graph the line found in part (b) the scatter diagram. Choose the correct graph below. (d) By hand, determine the least-squares regression line. (e) Graph the least-squares regression line on the scatter diagram. (f) Compute the sum of the squared residuals for the line found in part (b) (g) Compute the sum of the squared...
(2 points) Find the least-squares regression line y = bo +b x through the points (-2,0),...
 (2 points) Find the least-squares regression line y = bo +b x through the points (-2,0), (2,9), (6, 13), (8, 20), (10,27). For what value of x is 9 = 0?
 2. This problem finds the curve C ++D = b which gives the best least squares fit to the points: t= -2, b=0 t = -1, b=0 t= 0, b=1 t= 1, b=1 t= 2, b=1 (a) (10 points) Write down the 5 equations Ax = b that would be satisfied if the curve went through all 5 points. (b) (10 points) Find the least squares solution = (Ĉ, Ð). (c) (10 points) Find the projection p of b onto...
 Projections and Least Squares
3. Consider the points P (0,0), (1,8),(2,8),(3,20)) in R2, For each of the given function types f(x) below, . Find values for A, B, C that give the least squares fit to the set of points P . Graph your solution along with P (feel free to graph all functions on the same graph). . Compute sum of squares error ((O) -0)2((1) 8)2 (f(2) -8)2+ (f(3) - 20)2 for the least squares fit you found (a)...
Projections and Least Squares
3. Consider the points P (0,0), (1,8),(2,8),(3,20)) in R2, For each of the given function types f(x) below, . Find values for A, B, C that give the least squares fit to the set of points P . Graph your solution along with P (feel free to graph all functions on the same graph). . Compute sum of squares error ((O) -0)2((1) 8)2 (f(2) -8)2+ (f(3) - 20)2 for the least squares fit you found (a)...
 (a)
Sketch the line that appears to be the best fit for the given
points.
(b) Find the least squares regression line. y(x)=
(c) Calculate the sum of squared error.
11. [-13.22 Points] DETAILS LARLINALG8 2.6.017. Consider the following. 5 (1,5) 4 (2, 4) 3 2 (2, 2) (3, 1) - Х - 1 2 3 4 -14 (a) Sketch the line that appears to be the best fit for the given points.
(a)
Sketch the line that appears to be the best fit for the given
points.
(b) Find the least squares regression line. y(x)=
(c) Calculate the sum of squared error.
11. [-13.22 Points] DETAILS LARLINALG8 2.6.017. Consider the following. 5 (1,5) 4 (2, 4) 3 2 (2, 2) (3, 1) - Х - 1 2 3 4 -14 (a) Sketch the line that appears to be the best fit for the given points.
 (1 point) Find the least-squares regression line ý = b + b 2 through the points (-2,0), (1,7), (6, 15), (7, 20), (9, 24). For what value of I is ŷ = 0?
 Find the equation y = Bo + B,x of the least-squares line that best fits the given data points. (1,1), (2,1), (3,2), (4,2) The line is y=+x. (Type integers or decimals.) Find the equation y = B.+Byx of the least-squares line that best fits the given data points. (5,6), (6,4), (8,2), (9,0) The line is y=+x. (Type integers or decimals.) Find the equation y = Be + Box of the least-squares line that best fits the given data points. (-1,0),...
 only (c) please
Find the least squares fit to the data x0 12 (a) By a linear function. Plot your linear function along with the data on a coordinate system. (b) By a quadratic polynomial. Sketch the graph. c) By a function of the form ya2 b2*. 2-1
Find the least squares fit to the data x0 12 (a) By a linear function. Plot your linear function along with the data on a coordinate system. (b) By a quadratic polynomial....
only (c) please
Find the least squares fit to the data x0 12 (a) By a linear function. Plot your linear function along with the data on a coordinate system. (b) By a quadratic polynomial. Sketch the graph. c) By a function of the form ya2 b2*. 2-1
Find the least squares fit to the data x0 12 (a) By a linear function. Plot your linear function along with the data on a coordinate system. (b) By a quadratic polynomial....
 (2 points) Find the least squares regression line ý = b + b through the points (-2,0), (2,9), (5,15), (7,20),(10,26). For what value of cis y = 0? =
 down options for Part (h) are: (d) or (b)Complete parts (a) through (h) for the data below. x2030405060y7975706250 (b) Find the equation of the line containing the points (30,75) and (60,50). (c) Graph the line found in part (b) the scatter diagram. Choose the correct graph below. (d) By hand, determine the least-squares regression line. (e) Graph the least-squares regression line on the scatter diagram. (f) Compute the sum of the squared residuals for the line found in part (b) (g) Compute the sum of the squared...
 (2 points) Find the least-squares regression line y = bo +b x through the points (-2,0), (2,9), (6, 13), (8, 20), (10,27). For what value of x is 9 = 0?
Most questions answered within 3 hours.
-
1a. The __________ functional group often triggers our sense of
smell.
1b. The geometry around a...
asked 5 minutes ago -
A uniform plank of length 2.00 m and mass 34.0 kg is supported
by three ropes,...
asked 6 minutes ago -
Suppose a floor on a hospital has 12 physicians at any given
time. You are brought...
asked 20 minutes ago -
Compartmentalization
in eukaryotic cells facilitates chemical reactions happening faster
due to... Select all
Substrates needed for...
asked 7 minutes ago -
The deltaH for the solution process when solid sodium
hydroxide dissolves in water is 44.4 kJ/mol....
asked 10 minutes ago -
a. Discuss the reciprocal/opposite “hormonal” regulation of the
most highly regulated steps of these two pathways....
asked 28 minutes ago -
Members of unions had mounted campaigns to persuade customers
not to shop at a company because...
asked 29 minutes ago -
Why is the alpha carboxyl group pka value 2 ?
And why is an alpha amino...
asked 37 minutes ago -
Identify and assess an intrapreneurial
opportunities within Bank of America and
intrapreneurial assessment. Assess its impact...
asked 44 minutes ago -
How do I figure out the range of possible numbers that can be
represented by the...
asked 45 minutes ago -
A 0.48-kg metal sphere oscillates at the end of a vertical
spring. As the spring stretches...
asked 48 minutes ago -
If a block of Si is doped with 10^17 Boron atom/cm^3 and 5X10^16
Arsenic atoms/cm^3,
(a)...
asked 1 hour ago