
Homework Answers

Formula
Add Answer to:
VORE Senty Editor Use a three period simple moving average and weighted-moving average and Naive methods...
Use a three-period simple moving average and weighted-moving average and Naive methods to forecast the 8th...
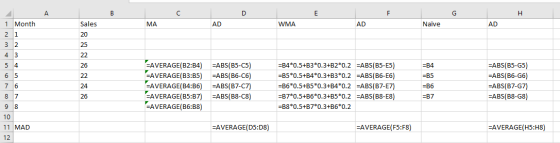
Use a three-period simple moving average and weighted-moving average and Naive methods to forecast the 8th month. Calculate and compare the MAD for methods. Month Sales MA AD WMA AD Naive AD 1 20 --- --- --- --- --- --- 2 25 --- --- --- --- --- --- 3 22 --- --- --- --- --- --- 4 26 5 22 6 24 7 26 8 ---- ? ? AD: Absolute Deviation MA: Moving Average WMA: Weighted Moving Average
You want to compare how two forecasting methods would perform on some historical sales data. You...
 You want to compare how two forecasting methods would perform on
some historical sales data. You will forecast the sales for months
4 through 19, calculate the mean absolute deviation (MAD) for both
methods, and you can claim that the one that has lower MAD
performed better, at least for the historical data.
a) The first method is known as the moving average method. The
forecast for a month will be the average sales of three previous
months. So, forecast...
You want to compare how two forecasting methods would perform on
some historical sales data. You will forecast the sales for months
4 through 19, calculate the mean absolute deviation (MAD) for both
methods, and you can claim that the one that has lower MAD
performed better, at least for the historical data.
a) The first method is known as the moving average method. The
forecast for a month will be the average sales of three previous
months. So, forecast...
This is a table to show how to calculate a three-month moving average. Please use this...
 This is a table to show how to calculate a three-month moving average. Please use this same data to calculate a four-month moving average. ACTUAL SHED SALES 10 12 13 16 19 23 26 30 28 18 16 MONTH 3-MONTH MOVING AVERAGE January March (10+ 12 + 13)3 -11.67 (12 13+ 16/3-13.67 (13 + 16 + 19)/3# 16.00 (16 + 19 +23Y3- 19.33 19 +23 + 26V3-22.67 (23+26 +30/3-26.33 (26+30 +28)V3-28.00 (30 +28 + 18/3-25.33 (28 + 18 + 163-20.67...
You are an operation manager at Gambas Berhad. You plan to use several forecasting methods for...
 You are an operation manager at Gambas Berhad. You plan to use several forecasting methods for the purpose. The following data represent the actual monthly company sales for 2018. Month Value (RM000 32 41 53 59 46 31 27 24 10 35 54 105 Ja March ril un August ber November December (a) Calculate the Mean Absolute Deviation (MAD) and make a forecast for January 2019 sales based on the following methods: i. 4-month moving average. (5 marks) i. Weighted...
pleasw reply fast for a thumbs up?? Question 3 (1 point) Absolute Error Percent error Squared...
 pleasw reply fast for a thumbs up??
Question 3 (1 point) Absolute Error Percent error Squared error Naive Period Sales($millions) Forecast Error 13.2 2 19.3 3 14.9 4 11.5 Using the Naive forecast, what will be the MAD (Mean Absolute Deviation) in the table above? (Round your answer to 2 decimal places) Your Answer: Answer Question 4 (1 point) The Absolute percent error for period 4 when Three period moving average forecast method is used:(Please round to 2 decimal places...
pleasw reply fast for a thumbs up??
Question 3 (1 point) Absolute Error Percent error Squared error Naive Period Sales($millions) Forecast Error 13.2 2 19.3 3 14.9 4 11.5 Using the Naive forecast, what will be the MAD (Mean Absolute Deviation) in the table above? (Round your answer to 2 decimal places) Your Answer: Answer Question 4 (1 point) The Absolute percent error for period 4 when Three period moving average forecast method is used:(Please round to 2 decimal places...
"The MAD for the forecast developed using a weighted 2-year moving average with weights of 0.45...
 "The MAD for the forecast developed using a weighted 2-year
moving average with weights of 0.45 and 0.55 = __ miles (round
your response to one decimal place). (Hint: You will have only 3
years of matched data.)"
Score: 0 of 1 pt 3 of 5 (1 complete) HW Score: 0%, 0 of 5 pts Problem 4.5 Question Help The Carbondale Hospital is considering the purchase of a new ambulance. The decision will rest partly on the anticipated mileage to...
"The MAD for the forecast developed using a weighted 2-year
moving average with weights of 0.45 and 0.55 = __ miles (round
your response to one decimal place). (Hint: You will have only 3
years of matched data.)"
Score: 0 of 1 pt 3 of 5 (1 complete) HW Score: 0%, 0 of 5 pts Problem 4.5 Question Help The Carbondale Hospital is considering the purchase of a new ambulance. The decision will rest partly on the anticipated mileage to...
Actual sales of TV's for the first six month in 2021 were as follows: January 60 ...
Actual sales of TV's for the first six month in 2021 were as follows: January 60 February 80 March 42 April 68 May 44 June 72 Use this information and determine in whole numbers: 1 The average actual monthly sales for that period 2 Trends: Reduce this average by 6% per month for the next three months 3 Simple Moving Average (SMA): make a forecast for July using a three months simple moving average. 4 Weighted Moving Average (WMA): make...
Forecasts for P5 to P12 using a 4-period simple moving average
 1. Given the data below, compute for the following: a) Forecasts for P5 to P12 using a 4-period simple moving average b) Forecasts for P5 to P12 using a 4-month weighted moving average with the following weights: Most recent period =0.40 2nd most recent period = 0.30 3rd most recent period = 0.20 4th most recent period = 0.10c) Assuming a forecast of 5,000 units for Period 4 and a = 0.30, compute for the forecasts for P5 to P12. d) Using linear trend forecasting, determine the: - equation...
National Scan, Inc., sells radio frequency inventory tags. Monthly sales for a seven-month period were as...
National Scan, Inc., sells radio frequency inventory tags. Monthly sales for a seven-month period were as follows: Month Sales (000)Units Feb. 17 Mar. 20 Apr. 14 May. 22 Jun. 21 Jul. 25 Aug. 29 b. Forecast September sales volume using each of the following: (1) A linear trend equation.(Round your intermediate calculations and final answer to 2 decimal places.) Yt _ thousands (2) A five-month moving average. (Round your answer to 2 decimal places.) Moving average _ thousands...
9:14 NAME: Please show work. following forecast models, what can be donc? Simple moving average: Naive...
 9:14 NAME: Please show work. following forecast models, what can be donc? Simple moving average: Naive method: 2. While monitoring the forecast values, the tracking signals are consistently coming out as large negative numbers (ie 3.5,-5.9,-7.8) What does this mean? s Given the actual data as below, what is the forecast for period 6, using a four-period weighted moving average with weights of.1,2,3 and 4 (greater weight towards more recent time)? Show work 4. Actual demand for the last four...
 You want to compare how two forecasting methods would perform on
some historical sales data. You will forecast the sales for months
4 through 19, calculate the mean absolute deviation (MAD) for both
methods, and you can claim that the one that has lower MAD
performed better, at least for the historical data.
a) The first method is known as the moving average method. The
forecast for a month will be the average sales of three previous
months. So, forecast...
You want to compare how two forecasting methods would perform on
some historical sales data. You will forecast the sales for months
4 through 19, calculate the mean absolute deviation (MAD) for both
methods, and you can claim that the one that has lower MAD
performed better, at least for the historical data.
a) The first method is known as the moving average method. The
forecast for a month will be the average sales of three previous
months. So, forecast...
 This is a table to show how to calculate a three-month moving average. Please use this same data to calculate a four-month moving average. ACTUAL SHED SALES 10 12 13 16 19 23 26 30 28 18 16 MONTH 3-MONTH MOVING AVERAGE January March (10+ 12 + 13)3 -11.67 (12 13+ 16/3-13.67 (13 + 16 + 19)/3# 16.00 (16 + 19 +23Y3- 19.33 19 +23 + 26V3-22.67 (23+26 +30/3-26.33 (26+30 +28)V3-28.00 (30 +28 + 18/3-25.33 (28 + 18 + 163-20.67...
 You are an operation manager at Gambas Berhad. You plan to use several forecasting methods for the purpose. The following data represent the actual monthly company sales for 2018. Month Value (RM000 32 41 53 59 46 31 27 24 10 35 54 105 Ja March ril un August ber November December (a) Calculate the Mean Absolute Deviation (MAD) and make a forecast for January 2019 sales based on the following methods: i. 4-month moving average. (5 marks) i. Weighted...
 pleasw reply fast for a thumbs up??
Question 3 (1 point) Absolute Error Percent error Squared error Naive Period Sales($millions) Forecast Error 13.2 2 19.3 3 14.9 4 11.5 Using the Naive forecast, what will be the MAD (Mean Absolute Deviation) in the table above? (Round your answer to 2 decimal places) Your Answer: Answer Question 4 (1 point) The Absolute percent error for period 4 when Three period moving average forecast method is used:(Please round to 2 decimal places...
pleasw reply fast for a thumbs up??
Question 3 (1 point) Absolute Error Percent error Squared error Naive Period Sales($millions) Forecast Error 13.2 2 19.3 3 14.9 4 11.5 Using the Naive forecast, what will be the MAD (Mean Absolute Deviation) in the table above? (Round your answer to 2 decimal places) Your Answer: Answer Question 4 (1 point) The Absolute percent error for period 4 when Three period moving average forecast method is used:(Please round to 2 decimal places...
 "The MAD for the forecast developed using a weighted 2-year
moving average with weights of 0.45 and 0.55 = __ miles (round
your response to one decimal place). (Hint: You will have only 3
years of matched data.)"
Score: 0 of 1 pt 3 of 5 (1 complete) HW Score: 0%, 0 of 5 pts Problem 4.5 Question Help The Carbondale Hospital is considering the purchase of a new ambulance. The decision will rest partly on the anticipated mileage to...
"The MAD for the forecast developed using a weighted 2-year
moving average with weights of 0.45 and 0.55 = __ miles (round
your response to one decimal place). (Hint: You will have only 3
years of matched data.)"
Score: 0 of 1 pt 3 of 5 (1 complete) HW Score: 0%, 0 of 5 pts Problem 4.5 Question Help The Carbondale Hospital is considering the purchase of a new ambulance. The decision will rest partly on the anticipated mileage to...
 9:14 NAME: Please show work. following forecast models, what can be donc? Simple moving average: Naive method: 2. While monitoring the forecast values, the tracking signals are consistently coming out as large negative numbers (ie 3.5,-5.9,-7.8) What does this mean? s Given the actual data as below, what is the forecast for period 6, using a four-period weighted moving average with weights of.1,2,3 and 4 (greater weight towards more recent time)? Show work 4. Actual demand for the last four...
Most questions answered within 3 hours.
-
(EPS with
Convertible Bonds) On June 1, 2012, Bluhm Company and
Amanar Company merged to form...
asked 1 minute from now -
The velocity field of a flow is given by V = (2+1) x
y2 i +...
asked 1 minute ago -
2. Discuss why the study exemplifies one that agrees with The
American Psychological Association’s (APA) Ethical...
asked 2 minutes ago -
Without considering the following capital gains and losses,
Charlene, who is single, has a taxable income...
asked 10 minutes ago -
1a. The __________ functional group often triggers our sense of
smell.
1b. The geometry around a...
asked 23 minutes ago -
A uniform plank of length 2.00 m and mass 34.0 kg is supported
by three ropes,...
asked 24 minutes ago -
Suppose a floor on a hospital has 12 physicians at any given
time. You are brought...
asked 38 minutes ago -
Compartmentalization
in eukaryotic cells facilitates chemical reactions happening faster
due to... Select all
Substrates needed for...
asked 24 minutes ago -
The deltaH for the solution process when solid sodium
hydroxide dissolves in water is 44.4 kJ/mol....
asked 27 minutes ago -
a. Discuss the reciprocal/opposite “hormonal” regulation of the
most highly regulated steps of these two pathways....
asked 46 minutes ago -
Members of unions had mounted campaigns to persuade customers
not to shop at a company because...
asked 47 minutes ago -
Why is the alpha carboxyl group pka value 2 ?
And why is an alpha amino...
asked 55 minutes ago