
Homework Answers
for x =100
for x =200

for x =500

| x | y |
| 100 | 16.7 |
| 100 | 12.2 |
| 100 | 8.4 |
| 100 | 6.6 |
| 200 | 15.3 |
| 200 | 10.7 |
| 200 | 10.3 |
| 200 | 21.1 |
| 500 | 45.6 |
| 500 | 43.9 |
| 500 | 47.7 |
| 500 | 43.2 |
| Total | 281.7 |
| Avearge | 23.475 |
So,

Subsituting value in table so,
| x | y |
 |
 |
 |
 |
| 100.00 | 16.70 | 10.98 | 32.78 | 45.90 | 156.25 |
| 100.00 | 12.20 | 10.98 | 1.50 | 127.13 | 156.25 |
| 100.00 | 8.40 | 10.98 | 6.63 | 227.26 | 156.25 |
| 100.00 | 6.60 | 10.98 | 19.14 | 284.77 | 156.25 |
| 200.00 | 15.30 | 14.35 | 0.90 | 66.83 | 83.27 |
| 200.00 | 10.70 | 14.35 | 13.32 | 163.20 | 83.27 |
| 200.00 | 10.30 | 14.35 | 16.40 | 173.58 | 83.27 |
| 200.00 | 21.10 | 14.35 | 45.56 | 5.64 | 83.27 |
| 500.00 | 45.60 | 45.10 | 0.25 | 489.52 | 467.64 |
| 500.00 | 43.90 | 45.10 | 1.44 | 417.18 | 467.64 |
| 500.00 | 47.70 | 45.10 | 6.76 | 586.85 | 467.64 |
| 500.00 | 43.20 | 45.10 | 3.61 | 389.08 | 467.64 |
| Total | 281.70 | 148.30 | 2976.92 | 2828.63 |
So,
| SSR | 2828.63 |
| SSE | 148.30 |
| SST | 2976.92 |
as given
a=3
n=12 so
| DOF | |
| Model | 2.00 |
| Error | 9.00 |
| Total | 11.00 |
now subsituting all value in anova table
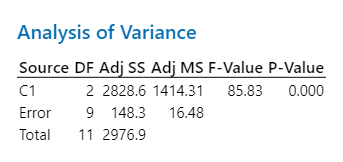
For α=0.05

Hope it helpful to you for any doubt comment below i will solve
your query
Rate my answer your rating is important to us
2. Using the following data set find a prediction equation ( 9 = ax + b)...
 2. Using the following data set find a prediction equation ( 9 = ax + b) relating the factor (x) and the response data (y). You can use Excel, Matlab, or similar software to help with the process. Comment on the predicted and adjusted R2 values of the resulting model. х у (y - ) (y-7) (ŷ - y) 100 100 100 100 200 200 200 200 500 500 500 500 16.7 12.2 8.4 6.6 15.3 10.7 10.3 21.1 45.6...
Section B: Long Questions - - B1: The following information regarding a dependent variable Y and...
 Section B: Long Questions - - B1: The following information regarding a dependent variable Y and an independent (SD1: 10 marks] variable X is provided EX= 180 EY=680 (Y - Y)(X-X) = -312 (X-X)2 - 468 (Y - Y)2 - 3,948 SSR - 208 n=4 Required: 1. Compute the total sum of squares (SST). (2 marks) 2. Compute the sum of squares due to error (SSE) (2 marks) 3. Compute the mean square error (MSE). (2 marks) 4. Compute the...
Using 3 variables and 13 observations, we are going to predict 'y. According to 0.05 significant...
 Using 3 variables and 13 observations, we are going to predict 'y. According to 0.05 significant level, present stepwise regression and find the value of R square Variables SSR (regression sum of squares) 1500 SSE (error sum of squares) 1000 X X₂, X2 xz, xz X2, X₃ X2, X2, X3 SST (total sum of squares) 2500 2500 2500 2500 2500 2500 2500 2500 1400 1300 1300 2250 2400 2435 2450 1100 1200 250 100 65 50
Name Economics 5 Ch 13 Practice The follo wing data are the monthly salaries y and the grade point averages x for students who obtained a bachelor's degree in business administ ration Obser vatio...
 Name Economics 5 Ch 13 Practice The follo wing data are the monthly salaries y and the grade point averages x for students who obtained a bachelor's degree in business administ ration Obser vation index xi 2.6 3300 3.4 3600 3.6 4000 3.2 3500 3.5 3900 2.9 3600 TSS Totals SSR SSE 1. Calculate and y 2. Use the least squares method to develop the estimated regression equation. Use two decimal points in your answers for bo and bi. 3....
4. Testing for significance Aa Aa Consider a multiple regression model of the dependent variable y on independent variables x1, x2, X3, and x4: Using data with n = 60 observations for each of the var...
 4. Testing for significance Aa Aa Consider a multiple regression model of the dependent variable y on independent variables x1, x2, X3, and x4: Using data with n = 60 observations for each of the variables, a student obtains the following estimated regression equation for the model given: 0.04 + 0.28X1 + 0.84X2-0.06x3 + 0.14x4 y She would like to conduct significance tests for a multiple regression relationship. She uses the F test to determine whether a significant relationship exists...
Consider a multiple regression model of the dependent variable y on independent variables x1, X2, X3, and x4: Using data with n 60 observations for each of the variables, a student obtains the follow...
 Consider a multiple regression model of the dependent variable y on independent variables x1, X2, X3, and x4: Using data with n 60 observations for each of the variables, a student obtains the following estimated regression equation for the model given: y0.35 0.58x1 + 0.45x2-0.25x3 - 0.10x4 He would like to conduct significance tests for a multiple regression relationship. He uses the F test to determine whether a significant relationship exists between the dependent variable and He uses the t...
B =X Y 1 17 3 15 5 10 7 7 9 1 HW 1 For...
B =X Y 1 17 3 15 5 10 7 7 9 1 HW 1 For the date above 1-1. Construct an Analysis of Regression table, below (Below is the regression table I made) Source of Variation Degrees of Freedom, d.f. Sums of Squares, SS Mean Squares, MS F, FR, MSR/MSE Total 4 164 Regression 1 160 160 120.3 Residual 3 4 1.33 (I need a help with this) 1-2. Test B= 0 with a = 1%
Please provide excel formulas Stat 3309 - Statistical Analysis for Business Applications I Consider the following...
 Please provide excel formulas Stat 3309 - Statistical Analysis for Business Applications I Consider the following data representing the total time in hours) a student spent on reviewing for the Stat 3309 final exam and the actual score on the final. The sample of 10 students was taken from a class and the following answers were reported. time score 0 23 4 30 5 32 7 50 8 45 10 55 12 60 15 70 18 80 20 100 Part...
Given are five observations for two variables, r and y. 3 4 5 1 2 7 6 11 14 4 The estimated regression equation is...
 Given are five observations for two variables, r and y. 3 4 5 1 2 7 6 11 14 4 The estimated regression equation is y = 1.2 + 2.4r Compute the mean square error using the following equation (to 3 decimals). a. SSE s2=MSE n- 2 decimals). b. Compute the standard error of the estimate using the following equation (to SSE VMSE Vn-2 SE c. Compute the estimated standard deviation bi using the following equation (to 3 decimals). Sp...
Please answer all fill in the blanks, thanks! In the United States, tire tread depth is...
 Please answer all fill in the blanks, thanks!
In the United States, tire tread depth is measured in 32nds of an inch. Car tires typically start out with 10/32 to 11/32 of an inch of tread depth. In most states, a tire is legally worn out when its tread depth reaches 2/32 of an inch. A random sample of four tires provides the following data on mileage and tread depth: Mileage (10,000 miles) Tread Depth (32nds of an inch) Tire...
Please answer all fill in the blanks, thanks!
In the United States, tire tread depth is measured in 32nds of an inch. Car tires typically start out with 10/32 to 11/32 of an inch of tread depth. In most states, a tire is legally worn out when its tread depth reaches 2/32 of an inch. A random sample of four tires provides the following data on mileage and tread depth: Mileage (10,000 miles) Tread Depth (32nds of an inch) Tire...
 2. Using the following data set find a prediction equation ( 9 = ax + b) relating the factor (x) and the response data (y). You can use Excel, Matlab, or similar software to help with the process. Comment on the predicted and adjusted R2 values of the resulting model. х у (y - ) (y-7) (ŷ - y) 100 100 100 100 200 200 200 200 500 500 500 500 16.7 12.2 8.4 6.6 15.3 10.7 10.3 21.1 45.6...
 Section B: Long Questions - - B1: The following information regarding a dependent variable Y and an independent (SD1: 10 marks] variable X is provided EX= 180 EY=680 (Y - Y)(X-X) = -312 (X-X)2 - 468 (Y - Y)2 - 3,948 SSR - 208 n=4 Required: 1. Compute the total sum of squares (SST). (2 marks) 2. Compute the sum of squares due to error (SSE) (2 marks) 3. Compute the mean square error (MSE). (2 marks) 4. Compute the...
 Using 3 variables and 13 observations, we are going to predict 'y. According to 0.05 significant level, present stepwise regression and find the value of R square Variables SSR (regression sum of squares) 1500 SSE (error sum of squares) 1000 X X₂, X2 xz, xz X2, X₃ X2, X2, X3 SST (total sum of squares) 2500 2500 2500 2500 2500 2500 2500 2500 1400 1300 1300 2250 2400 2435 2450 1100 1200 250 100 65 50
 Name Economics 5 Ch 13 Practice The follo wing data are the monthly salaries y and the grade point averages x for students who obtained a bachelor's degree in business administ ration Obser vation index xi 2.6 3300 3.4 3600 3.6 4000 3.2 3500 3.5 3900 2.9 3600 TSS Totals SSR SSE 1. Calculate and y 2. Use the least squares method to develop the estimated regression equation. Use two decimal points in your answers for bo and bi. 3....
 4. Testing for significance Aa Aa Consider a multiple regression model of the dependent variable y on independent variables x1, x2, X3, and x4: Using data with n = 60 observations for each of the variables, a student obtains the following estimated regression equation for the model given: 0.04 + 0.28X1 + 0.84X2-0.06x3 + 0.14x4 y She would like to conduct significance tests for a multiple regression relationship. She uses the F test to determine whether a significant relationship exists...
 Consider a multiple regression model of the dependent variable y on independent variables x1, X2, X3, and x4: Using data with n 60 observations for each of the variables, a student obtains the following estimated regression equation for the model given: y0.35 0.58x1 + 0.45x2-0.25x3 - 0.10x4 He would like to conduct significance tests for a multiple regression relationship. He uses the F test to determine whether a significant relationship exists between the dependent variable and He uses the t...
 Please provide excel formulas Stat 3309 - Statistical Analysis for Business Applications I Consider the following data representing the total time in hours) a student spent on reviewing for the Stat 3309 final exam and the actual score on the final. The sample of 10 students was taken from a class and the following answers were reported. time score 0 23 4 30 5 32 7 50 8 45 10 55 12 60 15 70 18 80 20 100 Part...
 Given are five observations for two variables, r and y. 3 4 5 1 2 7 6 11 14 4 The estimated regression equation is y = 1.2 + 2.4r Compute the mean square error using the following equation (to 3 decimals). a. SSE s2=MSE n- 2 decimals). b. Compute the standard error of the estimate using the following equation (to SSE VMSE Vn-2 SE c. Compute the estimated standard deviation bi using the following equation (to 3 decimals). Sp...
 Please answer all fill in the blanks, thanks!
In the United States, tire tread depth is measured in 32nds of an inch. Car tires typically start out with 10/32 to 11/32 of an inch of tread depth. In most states, a tire is legally worn out when its tread depth reaches 2/32 of an inch. A random sample of four tires provides the following data on mileage and tread depth: Mileage (10,000 miles) Tread Depth (32nds of an inch) Tire...
Please answer all fill in the blanks, thanks!
In the United States, tire tread depth is measured in 32nds of an inch. Car tires typically start out with 10/32 to 11/32 of an inch of tread depth. In most states, a tire is legally worn out when its tread depth reaches 2/32 of an inch. A random sample of four tires provides the following data on mileage and tread depth: Mileage (10,000 miles) Tread Depth (32nds of an inch) Tire...
Most questions answered within 3 hours.
-
Explain the differences between FIND and FINDSTR command in
windows:
[write in a few sentences]
asked 1 minute ago -
When solving for an optimal bundle using the Hicksian and
Marshallian demand, should you get the...
asked 5 minutes ago -
1. The standard width between rails on North American and most
European railroads is 5 ft...
asked 2 minutes ago -
A 200g block attached to a horizontal spring is oscillating with
an amplitude of 2.0cm and...
asked 4 minutes ago -
Which of these is a pure compound, which is an element, and
which is neither?
helium...
asked 8 minutes ago -
How much energy is required to vaporize 175 g of butane at its
boiling point? The...
asked 19 minutes ago -
X has a normal distribution with the given mean and
standard deviation. Find the indicated probability....
asked 21 minutes ago -
Calculate the probability that a particle will be found in a
tiny slice of space between...
asked 24 minutes ago -
Developed countries with some of the highest GDPs per
capita:
a)are not found outside of Europe...
asked 26 minutes ago -
draw a diagram illustrating the three ways of genetic
information flow
asked 42 minutes ago -
CASE 3-1 YOU CAN’T GET THERE FROM HERE: UBER SLOW ON
DIVERSITY
Established in 2009, Uber...
asked 41 minutes ago -
A local AM radio station broadcasts at an energy of
4.39×10⁻³¹ kJ/photon.
Calculate the frequency at...
asked 1 hour ago