
Homework Answers
Answer a:
Let x represent the Miles Trained and y represent the Time
The following table shows the calculations –
|
Miles Trained, (x) |
Time (minutes), (y) |
x^2 |
y^2 |
xy |
|
|
63 |
17.5 |
3969 |
306.25 |
1102.5 |
|
|
72 |
24.6 |
5184 |
605.16 |
1771.2 |
|
|
62 |
20.5 |
3844 |
420.25 |
1271 |
|
|
66 |
31.5 |
4356 |
992.25 |
2079 |
|
|
75 |
28.8 |
5625 |
829.44 |
2160 |
|
|
21 |
27.1 |
441 |
734.41 |
569.1 |
|
|
Total |
359 |
150 |
23419 |
3887.76 |
8952.8 |
Total number of observations, n = 6
Mean of x,  = 359/6 = 59.8333
Mean of y,  = 150/6 = 25
Standard Deviation of x, Sx = {( (x^2)/n)
- (^2)}^0.5
= {(23419/6) – (59.8333^2)}^0.5 = 17.9762
(x^2)/n)
- (^2)}^0.5
= {(23419/6) – (59.8333^2)}^0.5 = 17.9762
Standard Deviation of y, Sy = {((y^2)/n)
- (^2)}^0.5
= {(3887.76/6) – (25^2)}^0.5 = 4.7916
Covariance between x and y, Cov.(x, y) = (xy/n)
- ()
= (8952.8/6) – (59.8333 x 25) = -3.6992
Correlation coefficient, r = Cov.(x, y) / (Sx . Sy) = -3.6992 / (17.9762 x 4.7916) = -0.0429
(rounded up to 4 decimal places)
Answer
b:
The general way of obtaining a regression equation (least squares)
is given below -
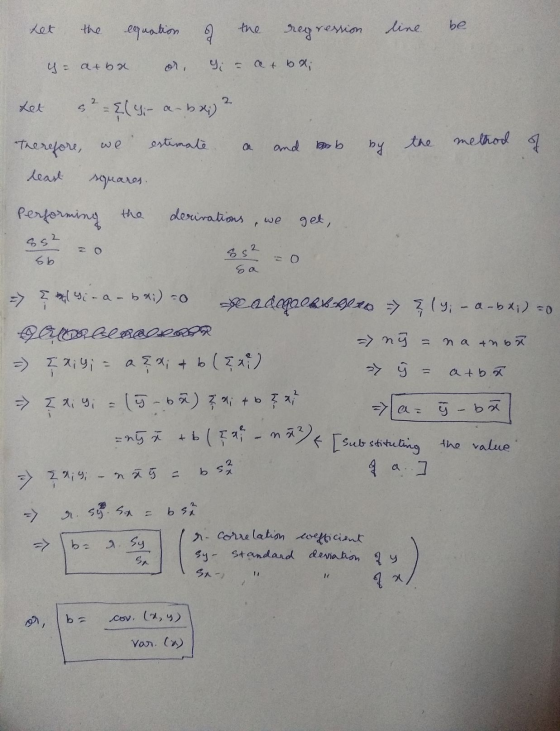
where b = a, is the slope of the regression equation and a = b, is the Y - Intercept of the equation
Therefore, Slope a = Cov.(x, y) / Var.(x) = -3.6992 / (17.9762^2) = -0.0114
Y - Intercept, b =
- b
= 25 - ((-0.0114) x 59.8333) = 25.6821
The regression equation is -
 (predicted value) = -0.0114x +
25.6821
(predicted value) = -0.0114x +
25.6821
Answer
c:
when x = 62 miles
= ((-0.0114) x 62) + 25.6821 = 24.9753
If someone trained 62 miles the time (predicted) taken to cover 5K is 24.9753 minutes
Answer
d:
Actual time taken to cover 5K when someone trained 62 miles is 20.5
minutes
Residual = Actual y value - Predicted y value = 20.5 - 24.9753 = -4.4753 minutes
(All values are rounded up to 4 decimal places)
Add Answer to:
Research was conducted on the amount of training for 5K and the time a contestant took...
Run a regression analysis on the following data set, where y is the final grade in...
 Run a regression analysis on the following data set, where y is the final grade in a math class and x is the average number of hours the student spent working on math each week. hours/week Grade х у 4 41.6 4 54.6 8 68.2 8 73.2 8 66.2 11 63.4 11 70.4 11 80.4 13 71.2 16 85.4 State the regression equation y = mx + b, with constants accurate to two decimal places. What is the predicted value...
Question 13 < > 0/2 pts 53 99 Details Research was conducted on the amount of...
 Question 13 < > 0/2 pts 53 99 Details Research was conducted on the amount of training for 5K and the time a contestant took to run the race. The researcher recorded the number of miles during training ( a 1 month period) and the time to complete the 5K. The results are below. Miles Trained 43 58 76 11 15 Time (Minutes) 24.5 20 30.9 16.4 37.7 33.2 a) Give the correlation coefficient. 44 b) Give the equation of...
The data below represent commute times (in minutes) and scores on a well-being survey. Commute Time...
The data below represent commute times (in minutes) and scores on a well-being survey. Commute Time (minutes), x 5 20 25 40 50 84 105 Well-Being Index Score, y 69.2 68.0 67.4 66.6 66.2 65.1 63.3 Given that r = -0.9841, Sx = 35.981, Sy = 1.942. a) Find the equation for the regression line. b) Interpret the slope and y-intercept. c) Find the predicted value of index score when x = 40. Find the residual for the value of...
What is the relationship between the amount of time statistics students study per week and their...
What is the relationship between the amount of time statistics students study per week and their test scores? The results of the survey are shown below. Time 16 14 15 6 14 15 6 Score 100 89 100 68 99 100 78 x-values y-values Find the correlation coefficient: r=r= Round to 2 decimal places. The null and alternative hypotheses for correlation are: H0:H0: ? ρ r μ == 0 H1:H1: ? μ r ρ ≠≠ 0 The p-value is: (Round to four decimal...
What is the relationship between the amount of time statistics students study per week and their...
 What is the relationship between the amount of time statistics students study per week and their final exam scores? The results of the survey are shown below. Time Score 3 67 13 95 6 15 77 89 13 100 3 66 7 63 11 79 1 59 a. Find the correlation coefficient: r = Round to 2 decimal places. b. The null and alternative hypotheses for correlation are: Ho: ? D = 0 H: ? *0 The p-value is: (Round...
What is the relationship between the amount of time statistics students study per week and their...
What is the relationship between the amount of time statistics students study per week and their test scores? The results of the survey are shown below. Time 13 10 9 9 2 10 12 8 Score 84 83 90 76 74 86 99 85 x-values y-values Find the correlation coefficient: r=r= Round to 2 decimal places. The null and alternative hypotheses for correlation are: H0:H0: ? r ρ μ == 0 H1:H1: ? μ ρ r ≠≠ 0 The p-value is: (Round to...
How much alcohol can one consume before one's Blood Alcohol Content (BAC) is above the legal limit? An experiment was conducted at Gallaudet University to predict Blood Alcohol Content fr...
 How much alcohol can one consume before one's Blood Alcohol Content (BAC) is above the legal limit? An experiment was conducted at Gallaudet University to predict Blood Alcohol Content from the number of beers. A total of 50 volunteer college students (some men and some women) were assigned a certain number of beers to drink and then, after a half an hour, their Blood Alcohol (BAC) level was measured. To make this assignment simpler, we will only use the first...
What is the relationship between the amount of time statistics students study per week and their...
What is the relationship between the amount of time statistics students study per week and their final exam scores? The results of the survey are shown below. Time 12 0 3 14 14 9 0 13 10 Score 95 60 73 85 86 89 65 97 93 Find the correlation coefficient: r=r= Round to 2 decimal places. The null and alternative hypotheses for correlation are: H0:H0: ? μ ρ r == 0 H1:H1: ? ρ μ r ≠≠ 0 The p-value is: (Round...
Chapter 4 Homewo . - Falls EMERS Activities and Due Dates > Chapter 4 Homework 1000/1300...
 Chapter 4 Homewo . - Falls EMERS Activities and Due Dates > Chapter 4 Homework 1000/1300 Resources cive Upt o Hint Animals often play an important role in the transportation of plant seeds. A 2014 study by Baldwin and Whitehead investigated the role played by fruit bats in seed transportation. The data provided give the wingspan length in millimeters and gut retention time (GRT) in minutes of seeds for each of the bats from this study. The GRT measures the...
Please answer all fill in the blanks, thanks! In the United States, tire tread depth is...
 Please answer all fill in the blanks, thanks!
In the United States, tire tread depth is measured in 32nds of an inch. Car tires typically start out with 10/32 to 11/32 of an inch of tread depth. In most states, a tire is legally worn out when its tread depth reaches 2/32 of an inch. A random sample of four tires provides the following data on mileage and tread depth: Mileage (10,000 miles) Tread Depth (32nds of an inch) Tire...
Please answer all fill in the blanks, thanks!
In the United States, tire tread depth is measured in 32nds of an inch. Car tires typically start out with 10/32 to 11/32 of an inch of tread depth. In most states, a tire is legally worn out when its tread depth reaches 2/32 of an inch. A random sample of four tires provides the following data on mileage and tread depth: Mileage (10,000 miles) Tread Depth (32nds of an inch) Tire...
 Run a regression analysis on the following data set, where y is the final grade in a math class and x is the average number of hours the student spent working on math each week. hours/week Grade х у 4 41.6 4 54.6 8 68.2 8 73.2 8 66.2 11 63.4 11 70.4 11 80.4 13 71.2 16 85.4 State the regression equation y = mx + b, with constants accurate to two decimal places. What is the predicted value...
 Question 13 < > 0/2 pts 53 99 Details Research was conducted on the amount of training for 5K and the time a contestant took to run the race. The researcher recorded the number of miles during training ( a 1 month period) and the time to complete the 5K. The results are below. Miles Trained 43 58 76 11 15 Time (Minutes) 24.5 20 30.9 16.4 37.7 33.2 a) Give the correlation coefficient. 44 b) Give the equation of...
 What is the relationship between the amount of time statistics students study per week and their final exam scores? The results of the survey are shown below. Time Score 3 67 13 95 6 15 77 89 13 100 3 66 7 63 11 79 1 59 a. Find the correlation coefficient: r = Round to 2 decimal places. b. The null and alternative hypotheses for correlation are: Ho: ? D = 0 H: ? *0 The p-value is: (Round...
 How much alcohol can one consume before one's Blood Alcohol Content (BAC) is above the legal limit? An experiment was conducted at Gallaudet University to predict Blood Alcohol Content from the number of beers. A total of 50 volunteer college students (some men and some women) were assigned a certain number of beers to drink and then, after a half an hour, their Blood Alcohol (BAC) level was measured. To make this assignment simpler, we will only use the first...
 Chapter 4 Homewo . - Falls EMERS Activities and Due Dates > Chapter 4 Homework 1000/1300 Resources cive Upt o Hint Animals often play an important role in the transportation of plant seeds. A 2014 study by Baldwin and Whitehead investigated the role played by fruit bats in seed transportation. The data provided give the wingspan length in millimeters and gut retention time (GRT) in minutes of seeds for each of the bats from this study. The GRT measures the...
 Please answer all fill in the blanks, thanks!
In the United States, tire tread depth is measured in 32nds of an inch. Car tires typically start out with 10/32 to 11/32 of an inch of tread depth. In most states, a tire is legally worn out when its tread depth reaches 2/32 of an inch. A random sample of four tires provides the following data on mileage and tread depth: Mileage (10,000 miles) Tread Depth (32nds of an inch) Tire...
Please answer all fill in the blanks, thanks!
In the United States, tire tread depth is measured in 32nds of an inch. Car tires typically start out with 10/32 to 11/32 of an inch of tread depth. In most states, a tire is legally worn out when its tread depth reaches 2/32 of an inch. A random sample of four tires provides the following data on mileage and tread depth: Mileage (10,000 miles) Tread Depth (32nds of an inch) Tire...
Most questions answered within 3 hours.
-
Hydration of norbornene
Write the reaction. Discuss the intermediate. Explain how the
equilibrium in the reaction...
asked 7 minutes ago -
While Dime Community Bank is based in Brooklyn; management has
decided to focus its lending activity...
asked 5 minutes ago -
Suppose that a party wanted to enter an FRA that expires in 42
days and is...
asked 7 minutes ago -
ABC Ltd. estimated that a new store requires an initial
investment of $800,000. This new store...
asked 8 minutes ago -
1. Review the Nike’s marketing strategy. You must include the
company’s target market, possible market segmentation,...
asked 20 minutes ago -
One of the major advantages of ______________ is to enhance
security for private networks by keeping...
asked 26 minutes ago -
Book:
Title: Framework for
Marketing Management, 15th edition
Author/s: Philip T.
Kotler, Kevin Lane Keller
1....
asked 35 minutes ago -
Given Uber’s recent corporate turbulence and ongoing
initiatives, provide a holistic situational analysis of the
environment...
asked 38 minutes ago -
A sculptor has hung up a 42.0 kg horizontal rod of length 4.80 m
. One...
asked 42 minutes ago -
What is the purpose of the 2' hydroxyl group in RNA? What is
the reason this...
asked 1 hour ago -
You currently have 20,000X ethidium bromide. You want to make
250 mL of 1X ethidium bromide...
asked 1 hour ago -
What mass of lead is needed to absorb 348 J of heat if the temp
of...
asked 1 hour ago