In class we had 41 95% confidence intervals that we believe to be calculated correctly. The...
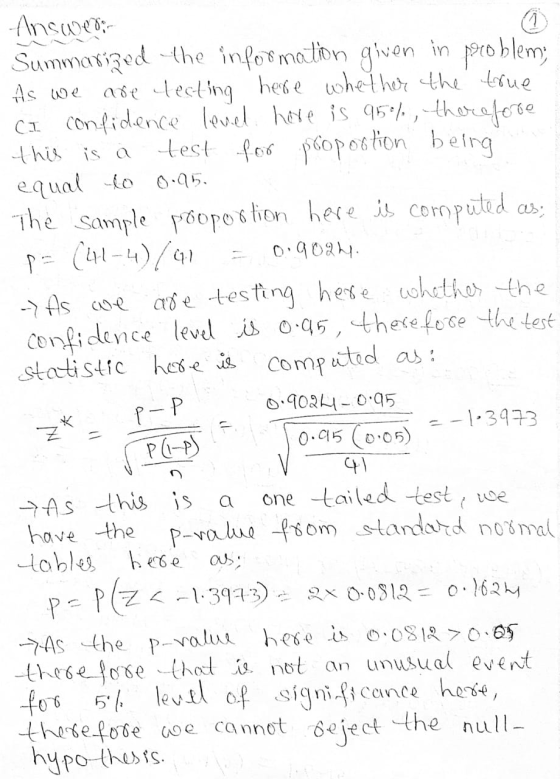
In class we had 41 95% confidence intervals that we believe to be calculated correctly. The confidence intervals were collected by taking a sample of 60 data points from the population data. 41 of the confidence intervals appear to be calculated correctly. Of these 4 of them do not have the population mean inside the confidence interval. Based on a 95% confidence, we expected 2 to not contain the population mean. Did this happen by chance alone? To find your answer, complete the 7 steps of hypothesis testing and compute Beta.
This was my data:
|
||||||||||||||||||||||||||||||||
Homework Answers

Add Answer to:
In class we had 41 95% confidence intervals that we believe to
be calculated correctly. The...
In class we had 41 95% confidence intervals that we believe to be calculated correctly. The...
In class we had 41 95% confidence intervals that we believe to be calculated correctly. The confidence intervals were collected by taking a sample of 60 data points from the population data. 41 of the confidence intervals appear to be calculated correctly. Of these 4 of them do not have the population mean inside the confidence interval. Based on a 95% confidence, we expected 2 to not contain the population mean. Did this happen by chance alone? To find your...
which of the following correctly describes a 95% confidence interval for a mean? Circle the correct...
 which of the following correctly describes a 95% confidence interval for a mean? Circle the correct answer. e, A range within which 95% of all possible sample means fall An interval constructed using a procedure such that 95% of intervals constructed this way will contain the population mean. A range within which 90% of all data values in the population fall All of the above None of the above . ii. iii. iv. v.
Explain what "95% confidence" means in a 95% confidence interval. What does "95% confidence" mean in...
Explain what "95% confidence" means in a 95% confidence interval. What does "95% confidence" mean in a 95% confidence interval? A. If 100 different confidence intervals are constructed, each based on a different sample of size n from the same population, then we expect 95 of the intervals to include the parameter and 5 to not include the parameter. B. The probability that the value of the parameter lies between the lower and upper bounds of the interval is 95%....
Let's say we have constructed a 95% confidence interval estimate for a population mean. Which of...
Let's say we have constructed a 95% confidence interval estimate for a population mean. Which of the following statements would be correct? A. We expect that 95% of the intervals so constructed would contain the true population mean. B. We are 95% sure that the true population mean lies either within the constructed interval or outside the constructed interval. C. Taking 100 samples of the same size, and constructing a new confidence interval from each sample, would yield five intervals...
Assume we have taken an SRS of 49 UCLA students and calculated a 95% confidence interval...
Assume we have taken an SRS of 49 UCLA students and calculated a 95% confidence interval for the mean age to be 23 < µ< 27 years. Determine which of the following interpretations are True. Then answer parts i and ii in the space below. A. A 95% confidence interval for the mean age of students at UCLA is 23 to 27. This means that 95% of all students are in this interval. B. A 95% confidence interval for the mean...
#9. Consider exercise 6 of Chapter 2. Suppose we calculated 95% confidence intervals for the population...
 #9. Consider exercise 6 of Chapter 2. Suppose we calculated 95%
confidence intervals for the population mean under each treatment.
(I don’t want you to actually calculate them.) Which treatment(s)
would have the widest and narrowest confidence intervals?
EXER Serum T3, (ng/dl) × 10-1 Treatment Premolt Fasting 60 g bran 197.18, 207.31, 177.50, 80 g bran 102.93, 117.51, 119.92, 112.01, 101.10 Laying mash 82.94, 83.14, 89.59, 87.76, 94.09, 90.45, 99.38, 73.56, 98.81, 103.55, 115.23, 129.06, 117.61 rite the linear statistical...
#9. Consider exercise 6 of Chapter 2. Suppose we calculated 95%
confidence intervals for the population mean under each treatment.
(I don’t want you to actually calculate them.) Which treatment(s)
would have the widest and narrowest confidence intervals?
EXER Serum T3, (ng/dl) × 10-1 Treatment Premolt Fasting 60 g bran 197.18, 207.31, 177.50, 80 g bran 102.93, 117.51, 119.92, 112.01, 101.10 Laying mash 82.94, 83.14, 89.59, 87.76, 94.09, 90.45, 99.38, 73.56, 98.81, 103.55, 115.23, 129.06, 117.61 rite the linear statistical...
Construct a 95% confidence interval to estimate the population mean using the data below. x=41 σ=8...
Construct a 95% confidence interval to estimate the population mean using the data below. x=41 σ=8 n=43 With 95% confidence, when n=43 the population mean is between a lower limit of... and an upper limit of
Explain what is meant by the statement, "We are 95% confident that an interval estimate contains...
 Explain what is meant by the statement, "We are 95% confident that an interval estimate contains μ" Choose the correct answer below. O A. The statement reflects the confidence in the particular interval found from this application. It explains that over many repetitions of this O B. The statement reflects the confidence in the estimation process rather than in the particular interval that is calculated from the sample ° C. The statement reflects the confidence in the particular interval found...
Explain what is meant by the statement, "We are 95% confident that an interval estimate contains...
 Explain what is meant by the statement, "We are 95% confident that an interval estimate contains μ" Choose the correct answer below. A. The statement reflects the confidence in the particular interval found from this application. It explains that there is a 95% chance that the O B. The statement reflects the confidence in the particular interval found from this application. It explains that over many repetitions of this O C. The statement reflects the confidence in the estimation process...
Distributions Cars Frequencies Confidence Intervals Level Count Prob 7 0.11667 28 0.46667 17 0.28333 8 0.13333...
 Distributions Cars Frequencies Confidence Intervals Level Count Prob 7 0.11667 28 0.46667 17 0.28333 8 0.13333 Total 60 1.00000 N Missing 0 4 Levels Level Count Prob Lower CI Upper CI 1-Alpha 7 0.11667 0.057677 0.221788 0.950 28 0.46667 0.346279 0.591066 0.950 17 0.28333 0.185068 0.407673 0.950 8 0.13333 0.069141 0.241652 0.950 Total 60 Note: Computed using score confidence intervals. here to access the JMP applet in a new window. (a) The most common number of cars per family is...
 which of the following correctly describes a 95% confidence interval for a mean? Circle the correct answer. e, A range within which 95% of all possible sample means fall An interval constructed using a procedure such that 95% of intervals constructed this way will contain the population mean. A range within which 90% of all data values in the population fall All of the above None of the above . ii. iii. iv. v.
 #9. Consider exercise 6 of Chapter 2. Suppose we calculated 95%
confidence intervals for the population mean under each treatment.
(I don’t want you to actually calculate them.) Which treatment(s)
would have the widest and narrowest confidence intervals?
EXER Serum T3, (ng/dl) × 10-1 Treatment Premolt Fasting 60 g bran 197.18, 207.31, 177.50, 80 g bran 102.93, 117.51, 119.92, 112.01, 101.10 Laying mash 82.94, 83.14, 89.59, 87.76, 94.09, 90.45, 99.38, 73.56, 98.81, 103.55, 115.23, 129.06, 117.61 rite the linear statistical...
#9. Consider exercise 6 of Chapter 2. Suppose we calculated 95%
confidence intervals for the population mean under each treatment.
(I don’t want you to actually calculate them.) Which treatment(s)
would have the widest and narrowest confidence intervals?
EXER Serum T3, (ng/dl) × 10-1 Treatment Premolt Fasting 60 g bran 197.18, 207.31, 177.50, 80 g bran 102.93, 117.51, 119.92, 112.01, 101.10 Laying mash 82.94, 83.14, 89.59, 87.76, 94.09, 90.45, 99.38, 73.56, 98.81, 103.55, 115.23, 129.06, 117.61 rite the linear statistical...
 Explain what is meant by the statement, "We are 95% confident that an interval estimate contains μ" Choose the correct answer below. O A. The statement reflects the confidence in the particular interval found from this application. It explains that over many repetitions of this O B. The statement reflects the confidence in the estimation process rather than in the particular interval that is calculated from the sample ° C. The statement reflects the confidence in the particular interval found...
 Explain what is meant by the statement, "We are 95% confident that an interval estimate contains μ" Choose the correct answer below. A. The statement reflects the confidence in the particular interval found from this application. It explains that there is a 95% chance that the O B. The statement reflects the confidence in the particular interval found from this application. It explains that over many repetitions of this O C. The statement reflects the confidence in the estimation process...
 Distributions Cars Frequencies Confidence Intervals Level Count Prob 7 0.11667 28 0.46667 17 0.28333 8 0.13333 Total 60 1.00000 N Missing 0 4 Levels Level Count Prob Lower CI Upper CI 1-Alpha 7 0.11667 0.057677 0.221788 0.950 28 0.46667 0.346279 0.591066 0.950 17 0.28333 0.185068 0.407673 0.950 8 0.13333 0.069141 0.241652 0.950 Total 60 Note: Computed using score confidence intervals. here to access the JMP applet in a new window. (a) The most common number of cars per family is...
Most questions answered within 3 hours.
-
The Bahraini public budget experiences deficit in the last
seven years, what are procedures are taken...
asked 4 minutes ago -
You invested $30,000 in a mutual fund at the beginning of the
year when the NAV...
asked 7 minutes ago -
Would you expect the price elasticity of supply for guitars to
be more inelastic in the...
asked 9 minutes ago -
A snowmobile is originally at the point with position vector
30.1 m at 95.0° counterclockwise from...
asked 9 minutes ago -
MAN3240 Organizational Behavior
In one to two paragraphs
6.) How can understanding emotions make me more...
asked 17 minutes ago -
Identify one individual who, in your opinion, is an excellent
leader. List the qualities that this...
asked 15 minutes ago -
For the data set shown below, complete parts (a) through (d)
below. x 3 4 5...
asked 21 minutes ago -
A university administrator working in student housing wants to
determine if the percentage of students residing...
asked 34 minutes ago -
3). Describe human population growth that has occurred in the
past 400 years. Use terms learned...
asked 32 minutes ago -
A
projectile is blue at a target. The distance from the point of
impact to the...
asked 56 minutes ago -
Given a 32 bit processor, with 2 MB of physical RAM split into 512
frames. What...
asked 46 minutes ago -
What were the main rulings in the Supreme Court cases which are
Morgan v. Virginia (1946)...
asked 46 minutes ago