
Homework Answers
(a)
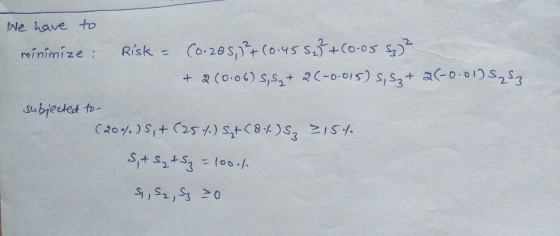

So, portfolio is 38% stock 1
14% stock 2
48% stock 3
(b)
| % | STOCK 1 | STOCK 2 | STOCK 3 | RISK |
| 20% | 59% | 29% | 12% | 0.061945 |
| 25% | 0% | 100% | 0% | 0.202494 |
above 25% we are unable to find feasible solution. it doesn't satisfy all constraints.
.
.
Please give it a thumbs up if this solution helped you. Still any doubt ? Comment box is all yours, I will be happy to help you :)
Add Answer to:
Assume you are professional manager of large stock portfolios and use computer models based on nonlinear...
Assume you are professional manager of large stock portfolios and use computer models based on nonlinear...
 Assume you are professional manager of large stock portfolios and use computer models based on nonlinear programming to guide them. • Investors are concerned about both the expected return and the risk. • One way of formulating their approach is as a nonlinear version of a cost-benefit trade-off problem: • Minimize Risk subject to Expected return 2 Minimum acceptable level . Consider a portfolio with 3 stocks. Risk Joint Risk Expected Pair of Stock (Standard Return per Stock Stocks Deviation...
Assume you are professional manager of large stock portfolios and use computer models based on nonlinear...
 Assume you are professional manager of large stock portfolios and use computer models based on nonlinear programming to guide them. • Investors are concerned about both the expected return and the risk. • One way of formulating their approach is as a nonlinear version of a cost-benefit trade-off problem: • Minimize Risk subject to Expected return 2 Minimum acceptable level Consider a portfolio with 3 stocks. . Stock Risk Joint Risk Expected Pair of (Standard per Stock Return Stocks Deviation)...
Q2 (e) Assume for simplicity sake that one factor has been deemed appropriate to "explain" returns...
 Q2
(e) Assume for simplicity sake that one factor has been deemed appropriate to "explain" returns on stocds (0) How and there is no idiosyncratic risk. Derive the arbitrage pricing theory would you perform a test of the predictions of the capital asset pricing model given historical data (APT) model 2. Consider Tablo 1 Return and Variance a/c to the Stocks Sample Covariance Residual AlphaBeta Expected Variance and Return | with Market | Variance | (96) Return Market 3.60 4.80...
Q2
(e) Assume for simplicity sake that one factor has been deemed appropriate to "explain" returns on stocds (0) How and there is no idiosyncratic risk. Derive the arbitrage pricing theory would you perform a test of the predictions of the capital asset pricing model given historical data (APT) model 2. Consider Tablo 1 Return and Variance a/c to the Stocks Sample Covariance Residual AlphaBeta Expected Variance and Return | with Market | Variance | (96) Return Market 3.60 4.80...
Pinulo retums? 1 0 capital asset pricing model given historical data 2. Consider Table 1. (%)...
 Pinulo retums? 1 0 capital asset pricing model given historical data 2. Consider Table 1. (%) 3.77 Table 1 Summary Statistics Alpha, Beta, Expected Return and Variance a/c to the Stocks Sample Single Index Model Covariance Residual and Return Alpha Beta with Market Expected Variance Variance Market (%) (%) Return (%) (%) 3.60 3.59 4.80 Market 4.20 0.00 8.70 (a) Consider Table 1. Using the single index model, calculate beta and alpha for stocks 1 and 2. Interpret your findings....
Question 2: Given three securities: Expected Standard Return Deviation Stock 10.15 0.20 Stock 20.20 0.30 Stock...
 Question 2: Given three securities: Expected Standard Return Deviation Stock 10.15 0.20 Stock 20.20 0.30 Stock 30.08 0.10 Stock 3 Correlation of Returns Stock 1 Stock 2 1.00 0.20 0.30 1.00 0.80 1.00 (a) Find the expected return and standard deviation of a portfolio with 25% in stock 1, 50% in stock 2, and 25% in stock 3. (b) For the portfolio in part (a), find the covariance of its return with the return of an equally weighted portfolio of...
3. Consider Table 3 Table 3 Stock Expected Return 10% 5% Standard Deviation 12% 8% Correlation...
 3. Consider Table 3 Table 3 Stock Expected Return 10% 5% Standard Deviation 12% 8% Correlation Coefficient 0.40 (a) Consider Table 3. Compute the expected return and standard deviation of return of an equally-weighted portfolio of stocks A and B (b) Consider Table 3. Solve for the composition, expected return and standard deviation of the minimum variance portfolio (c) Consider Table 3. Sketch the set of portfolios comprised of stocks A and B (d) Consider Table 3. Suppose that a...
Question 1: You are planning about putting some money in the stock market. There are two...
Question 1: You are planning about putting some money in the stock market. There are two stocks in your mind: stock A and stock B. The economy can either go in recession or it will boom in the coming years. Being an optimistic investor, you believe the likelihood of observing an economic boom is two times as high as observing an economic depression. You also know the following about your two stocks: State of the Economy Probability RA RB Boom...
Intro Assume that there are only two stocks in the economy, stock A and stock B. The risk-free asset has a return of 3%...
 Intro Assume that there are only two stocks in the economy, stock A and stock B. The risk-free asset has a return of 3%. The optimal risky portfolio, i.e., the portfolio with the highest Sharpe ratio, is given below: A BC Stock A Stock B Risk-free asset 2 Expected return 0.062 0.075 0.03 3 Variance 0.1521 0.0484 4 Standard deviation 0.39 0.22 5 Covariance 0.02574 D Optimal risky portfolio 8 Weights 9 Expected return 10 Variance 11 Standard deviation 12...
Use the following yearly rate of return valoes for Questions 1, 2, 3, and4. Market Risk-frre...
 Use the following yearly rate of return valoes for Questions 1, 2, 3, and4. Market Risk-frre Year Stock A Stock B Stock C retura return 2008 9.0% 8.0% 11.0% 10.0% 1.0% 2009 10.0% 11.0% 3.0% 9.0% 10% 2010 -3.0% 6.0% -6.0% 8.0% 10% 2011 -3.0% -110% -11.0% -15.0% 1.0n% 2012 9.0 % 3.0% 6.% 6.0% 10% 2013 -8.0% -4.0% -2.0% 20% 10% 2014 11.0% 15.% 13.0% 6.0% 10% -2.0% 10% 2015 -9.0% -5.0% -5.0% 2016 3.0% 1.0% 10.0% 14.0% 14.0%...
1. You are working in a financial intermediary and your manager asks you to analyze stocks of two different companies trading on Borsa İstanbul. The first company is called R&H Inc. (RHI) an...
 1. You are working in a financial intermediary and your manager asks you to analyze stocks of two different companies trading on Borsa İstanbul. The first company is called R&H Inc. (RHI) and the second company is called M&L Corp. (MLC). Both of these companies are in consumer's goods industry and founded at the beginning of the 20th century. You do not know what the returns on these company stocks will be for the next year but you have some...
 Assume you are professional manager of large stock portfolios and use computer models based on nonlinear programming to guide them. • Investors are concerned about both the expected return and the risk. • One way of formulating their approach is as a nonlinear version of a cost-benefit trade-off problem: • Minimize Risk subject to Expected return 2 Minimum acceptable level . Consider a portfolio with 3 stocks. Risk Joint Risk Expected Pair of Stock (Standard Return per Stock Stocks Deviation...
 Assume you are professional manager of large stock portfolios and use computer models based on nonlinear programming to guide them. • Investors are concerned about both the expected return and the risk. • One way of formulating their approach is as a nonlinear version of a cost-benefit trade-off problem: • Minimize Risk subject to Expected return 2 Minimum acceptable level Consider a portfolio with 3 stocks. . Stock Risk Joint Risk Expected Pair of (Standard per Stock Return Stocks Deviation)...
 Q2
(e) Assume for simplicity sake that one factor has been deemed appropriate to "explain" returns on stocds (0) How and there is no idiosyncratic risk. Derive the arbitrage pricing theory would you perform a test of the predictions of the capital asset pricing model given historical data (APT) model 2. Consider Tablo 1 Return and Variance a/c to the Stocks Sample Covariance Residual AlphaBeta Expected Variance and Return | with Market | Variance | (96) Return Market 3.60 4.80...
Q2
(e) Assume for simplicity sake that one factor has been deemed appropriate to "explain" returns on stocds (0) How and there is no idiosyncratic risk. Derive the arbitrage pricing theory would you perform a test of the predictions of the capital asset pricing model given historical data (APT) model 2. Consider Tablo 1 Return and Variance a/c to the Stocks Sample Covariance Residual AlphaBeta Expected Variance and Return | with Market | Variance | (96) Return Market 3.60 4.80...
 Pinulo retums? 1 0 capital asset pricing model given historical data 2. Consider Table 1. (%) 3.77 Table 1 Summary Statistics Alpha, Beta, Expected Return and Variance a/c to the Stocks Sample Single Index Model Covariance Residual and Return Alpha Beta with Market Expected Variance Variance Market (%) (%) Return (%) (%) 3.60 3.59 4.80 Market 4.20 0.00 8.70 (a) Consider Table 1. Using the single index model, calculate beta and alpha for stocks 1 and 2. Interpret your findings....
 Question 2: Given three securities: Expected Standard Return Deviation Stock 10.15 0.20 Stock 20.20 0.30 Stock 30.08 0.10 Stock 3 Correlation of Returns Stock 1 Stock 2 1.00 0.20 0.30 1.00 0.80 1.00 (a) Find the expected return and standard deviation of a portfolio with 25% in stock 1, 50% in stock 2, and 25% in stock 3. (b) For the portfolio in part (a), find the covariance of its return with the return of an equally weighted portfolio of...
 3. Consider Table 3 Table 3 Stock Expected Return 10% 5% Standard Deviation 12% 8% Correlation Coefficient 0.40 (a) Consider Table 3. Compute the expected return and standard deviation of return of an equally-weighted portfolio of stocks A and B (b) Consider Table 3. Solve for the composition, expected return and standard deviation of the minimum variance portfolio (c) Consider Table 3. Sketch the set of portfolios comprised of stocks A and B (d) Consider Table 3. Suppose that a...
 Intro Assume that there are only two stocks in the economy, stock A and stock B. The risk-free asset has a return of 3%. The optimal risky portfolio, i.e., the portfolio with the highest Sharpe ratio, is given below: A BC Stock A Stock B Risk-free asset 2 Expected return 0.062 0.075 0.03 3 Variance 0.1521 0.0484 4 Standard deviation 0.39 0.22 5 Covariance 0.02574 D Optimal risky portfolio 8 Weights 9 Expected return 10 Variance 11 Standard deviation 12...
 Use the following yearly rate of return valoes for Questions 1, 2, 3, and4. Market Risk-frre Year Stock A Stock B Stock C retura return 2008 9.0% 8.0% 11.0% 10.0% 1.0% 2009 10.0% 11.0% 3.0% 9.0% 10% 2010 -3.0% 6.0% -6.0% 8.0% 10% 2011 -3.0% -110% -11.0% -15.0% 1.0n% 2012 9.0 % 3.0% 6.% 6.0% 10% 2013 -8.0% -4.0% -2.0% 20% 10% 2014 11.0% 15.% 13.0% 6.0% 10% -2.0% 10% 2015 -9.0% -5.0% -5.0% 2016 3.0% 1.0% 10.0% 14.0% 14.0%...
 1. You are working in a financial intermediary and your manager asks you to analyze stocks of two different companies trading on Borsa İstanbul. The first company is called R&H Inc. (RHI) and the second company is called M&L Corp. (MLC). Both of these companies are in consumer's goods industry and founded at the beginning of the 20th century. You do not know what the returns on these company stocks will be for the next year but you have some...
Most questions answered within 3 hours.
-
7.
________ involves individuals trading goods they already have or
providing services in exchange for something...
asked 5 seconds ago -
Share your research problem. What databases did you search as
you gathered evidence to support your...
asked 4 seconds ago -
what process occurs to form microspores and megaspores in flowering
plants?
asked 7 minutes ago -
C++
I need to use the function getData to put in all my data using
arrays....
asked 6 minutes ago -
A block is hung by a string from the inside roof of a van. When
the...
asked 13 minutes ago -
Do you think companies should not go for long term debt in their
capital structure to...
asked 22 minutes ago -
I create an address book where the user enters the name, phone
and email in the...
asked 28 minutes ago -
The production capacity for acrylonitrile
(C3H3N) in the United States exceeds 2
million pounds per year....
asked 35 minutes ago -
explain and comment out your answer
43. How many address lines are required to address a...
asked 42 minutes ago -
A sample of 45 observations is selected from a normal
population. The sample mean is 49,...
asked 56 minutes ago -
A construction company is planning to bid on a building
contract. The bid costs the company...
asked 54 minutes ago -
A firm operating in a purely competitive environment is faced
with a market price of $250....
asked 1 hour ago