
Homework Answers
I am using excel to solve this. Hope it helps!
The equation comes out to be y = 1.56x + 7.70
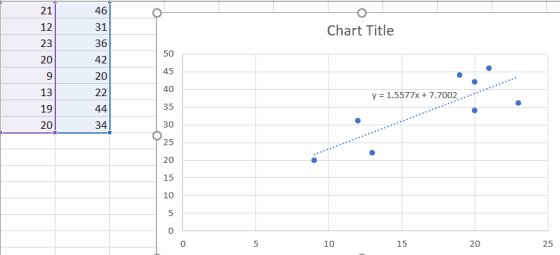
The predicted demand on a day with 16 deree temperature = 1.56 * 16 + 7.70 = 32.66 = 33 (rounded to nearest integer)
Add Answer to:
The following table shows the hot dogs bought from a street vendor over the course of...
The following table shows the hot dogs bought from a street vendor over the course of...
 The following table shows the hot dogs bought from a street vendor over the course of eight days ("Demand"). Also shown is the temperature for each day in degrees Celsius. Complete parts a and b below. Temperature (°C) 19 11 25 18 8 13 16 22 Demand 48 29 35 40 16 25 44 34 a. Calculate the slope and y-intercept for the linear regression equation for these data. (Round to two decimal places as needed.) b. Predict the demand...
The following table shows the hot dogs bought from a street vendor over the course of...
 The following table shows the hot dogs bought from a street vendor over the course of eight days ("Demand). Also shown is the temperature for each day in degrees Celsius Complete parts a and below. Temperature (°C) 19 13 22 18 5 13 17 21 le Demand 4730 35 4220 2144 a. Calculate the slope and y-intercept for the linear regression equation for these data 9-0 ( (Round to two decimal places as needed)
The following table shows the hot dogs bought from a street vendor over the course of...
The following table shows the hot dogs bought from a street vendor over the course of eight days ("Demand"). Also shown is the temperature for each day in degrees Celsius. Complete parts a and b below. Temperature Demand 20 45 9 32 23 36 17 40 8 19 13 22 20 44 22 31 a. calculate the slope and y-intercept for the linear regression equation for these data y=____ + (____)x b. Calculate how many hotdogs would be sold on...
The following table shows the hot dogs bought from a street vendor over the course of...
 The following table shows the hot dogs bought from a street vendor over the course of eight days ("Demand"). Also shown is the temperatun for each day in degrees Celsius. Complete parts a and b below. Temperature (°C) 18° 9 22 16 7 12 19 | 220 Demand 45 28 36 39 18 22 4032 a. Calculate the slope and y-intercept for the linear regression equation for these 9 - x (Round to two decimal places as needed.)
This Question: 1 pt 1 of 16 The following table shows the hot dogs bought from...
 This Question: 1 pt 1 of 16 The following table shows the hot dogs bought from a street vendor over the course of eight days (Demand"). Also shown is the temperature for each day in degrees Celsius. Complete parts a and b below. 22 İ 13 İ 22 İ 17 | 7 | 12 | 19 Temperature( nd 4732 Dema35 38 1 20122|4233 a. Calculate the slope and y-intercept for the linear regression equation for these data (Round to two...
The following table shows the hot dogs bought from a street vendor over the course of...
The following table shows the hot dogs bought from a street vendor over the course of eight days ("Demand"). Also shown is the temperature for each day in degrees Celsius. nbsp Temperature (C*): 22 12 22 19 7 11 16 23 Demand: 50 30 36 40 18 25 40 31 A linear regression on the data gives the equation below. Complete parts a through d below. Predicted Demand equals 13.22 plus 1.24 left parenthesis Temperature right parenthesis a. Calculate the...
1. David is a street vendor who sells hot dogs in the city and would like...
1. David is a street vendor who sells hot dogs in the city and would like to develop a regression model to help him predict the daily demand for his product in order to improve inventory control. David believes that the three main factors affecting hot dog demand for a particular day are his price per hot dog, the high temperature during business hours that day, and whether the day falls on a weekday or weekend (many of David’s customers...
Managers of an outdoor coffee stand in Coast City are examining the relationship between (hot) coffee...
 Managers of an outdoor coffee stand in Coast City are examining the relationship between (hot) coffee sales and daily temperature, hoping to be able to predict a day's total coffee sales from the maxim&m temperature that day. The bivariate data values for the coffee sales (denoted by y, in dollars) and the maximum temperature (denoted by x, in degrees Fahrenheit) for each of sixteen randomly selected days during the past year are given below. These data are plotted in the...
A particular professor has noticed that the number of people, P, who complain about his attitude is dependent on the number of cups of coffee, n, he drinks. From eight days of tracking he compiled the following data:
A particular professor has noticed that the number of people, P, who complain about his attitude is dependent on the number of cups of coffee, n, he drinks. From eight days of tracking he compiled the following data:People (P)1110967655Cups of coffee (n)11233445Unless otherwise stated, you can round values to two decimal places.a) Using regression to find a linear equation for P(n)P(n)P(n) = b) Find the correlation coefficientrr = c) Does the correlation coefficient indicate a strong linear trend, a weak linear trend, or no linear trend?strong linear...
the questions for the table for number 14 was added For questions 13-16: Light exposure in...
 the questions for the table for number 14 was added
For questions 13-16: Light exposure in mice Studies show that night-time light exposure is hamful to human health. A recent 6-week study randomly assigned lab mice to one of three conditions: LD (Group 1) had a standard light/dark cycle cach 24-hour period; (Group 2) LL had bright light all the time, and (Group 3) DM had dim light when there nomally would have been darkness. The rescarchers hoped to investigate...
the questions for the table for number 14 was added
For questions 13-16: Light exposure in mice Studies show that night-time light exposure is hamful to human health. A recent 6-week study randomly assigned lab mice to one of three conditions: LD (Group 1) had a standard light/dark cycle cach 24-hour period; (Group 2) LL had bright light all the time, and (Group 3) DM had dim light when there nomally would have been darkness. The rescarchers hoped to investigate...
 The following table shows the hot dogs bought from a street vendor over the course of eight days ("Demand"). Also shown is the temperature for each day in degrees Celsius. Complete parts a and b below. Temperature (°C) 19 11 25 18 8 13 16 22 Demand 48 29 35 40 16 25 44 34 a. Calculate the slope and y-intercept for the linear regression equation for these data. (Round to two decimal places as needed.) b. Predict the demand...
 The following table shows the hot dogs bought from a street vendor over the course of eight days ("Demand). Also shown is the temperature for each day in degrees Celsius Complete parts a and below. Temperature (°C) 19 13 22 18 5 13 17 21 le Demand 4730 35 4220 2144 a. Calculate the slope and y-intercept for the linear regression equation for these data 9-0 ( (Round to two decimal places as needed)
 The following table shows the hot dogs bought from a street vendor over the course of eight days ("Demand"). Also shown is the temperatun for each day in degrees Celsius. Complete parts a and b below. Temperature (°C) 18° 9 22 16 7 12 19 | 220 Demand 45 28 36 39 18 22 4032 a. Calculate the slope and y-intercept for the linear regression equation for these 9 - x (Round to two decimal places as needed.)
 This Question: 1 pt 1 of 16 The following table shows the hot dogs bought from a street vendor over the course of eight days (Demand"). Also shown is the temperature for each day in degrees Celsius. Complete parts a and b below. 22 İ 13 İ 22 İ 17 | 7 | 12 | 19 Temperature( nd 4732 Dema35 38 1 20122|4233 a. Calculate the slope and y-intercept for the linear regression equation for these data (Round to two...
 Managers of an outdoor coffee stand in Coast City are examining the relationship between (hot) coffee sales and daily temperature, hoping to be able to predict a day's total coffee sales from the maxim&m temperature that day. The bivariate data values for the coffee sales (denoted by y, in dollars) and the maximum temperature (denoted by x, in degrees Fahrenheit) for each of sixteen randomly selected days during the past year are given below. These data are plotted in the...
 the questions for the table for number 14 was added
For questions 13-16: Light exposure in mice Studies show that night-time light exposure is hamful to human health. A recent 6-week study randomly assigned lab mice to one of three conditions: LD (Group 1) had a standard light/dark cycle cach 24-hour period; (Group 2) LL had bright light all the time, and (Group 3) DM had dim light when there nomally would have been darkness. The rescarchers hoped to investigate...
the questions for the table for number 14 was added
For questions 13-16: Light exposure in mice Studies show that night-time light exposure is hamful to human health. A recent 6-week study randomly assigned lab mice to one of three conditions: LD (Group 1) had a standard light/dark cycle cach 24-hour period; (Group 2) LL had bright light all the time, and (Group 3) DM had dim light when there nomally would have been darkness. The rescarchers hoped to investigate...
Most questions answered within 3 hours.
-
The activation energy for a given reaction is 50.3 kJ/mol. If
the rate constant for the...
asked 1 minute ago -
An entomologist discovers a dung beetle rolling a ball of dung
along the ground, and decides...
asked 1 hour ago -
Humans have used horses for transportation for millions of
years. Therefore, they will use horses for...
asked 3 hours ago -
The following are the Jensen Corporation's unit costs of making
and selling an item at a...
asked 4 hours ago -
Does direct Medicare reimbursement of Advanced practice nurses
increase access to their services?
asked 5 hours ago -
List and explain why a company would choose to use a
published
compensation survey vs. creating...
asked 5 hours ago -
A discrete random variable X can take values from 1 to 10. Find
the variance of...
asked 5 hours ago -
The primary financial goal of a corporation is to maximize:
shareholders wealth.
earnings per share.
stock...
asked 5 hours ago -
determine whether the vectors u=(1,2,3,), v=(-2,1,0) and
w=(1,0,1) are linearly dependent or independent.
asked 5 hours ago -
python
Define a function called print_values which takes a dictionary
object as a parameter. The function...
asked 6 hours ago -
In Chapter 1 you created a program named Triangle in
which you displayed a seven-line triangle...
asked 6 hours ago -
Research question: What are the differences between separately
stated and non separately stated transactions in an...
asked 6 hours ago