


14. Complete the ANOVA table below by filling in the blank cells that are not greyed out. Refer to the question about Light exposure in mice Degrees of Sum of Squares Mean square Source F-ratio Freedom Light Error 161.84 Total 274.92
For questions 17-20: Match the corelation coefficient to the scatter plot. Choose from the following values, using each only once: Use the "best" values that match the scatterplot 1.25, 0.95, 0.75, 0.52 0.08, -0.56, 0.76. -0.99 18 19 20 21. A sample of size n-27 is used to conduct a significance test for H -75 versus H 75. The test statistic is -3.45. What are the degrees of freedom for this test statistic? A) 26 B) 27 74 D) 75 Use the following for Question 22 & 23: A simple random sample of eight drivers was selected. All eight drivers are insured with the same insurance company, and all have similar auto insurance policies. The following table lists their driving experiences (in years) and monthly auto insurance premiums. Driving experience (years) Monthly auto insurance premium (S) 5 2 12 64 77 50 71 44 56 42 60 15 6 25 16 22. What is the equation of the least square regression line? Round your answer to one decimal 23. Predict the monthly auto insurance premium for a driver with 10 years of driving experience
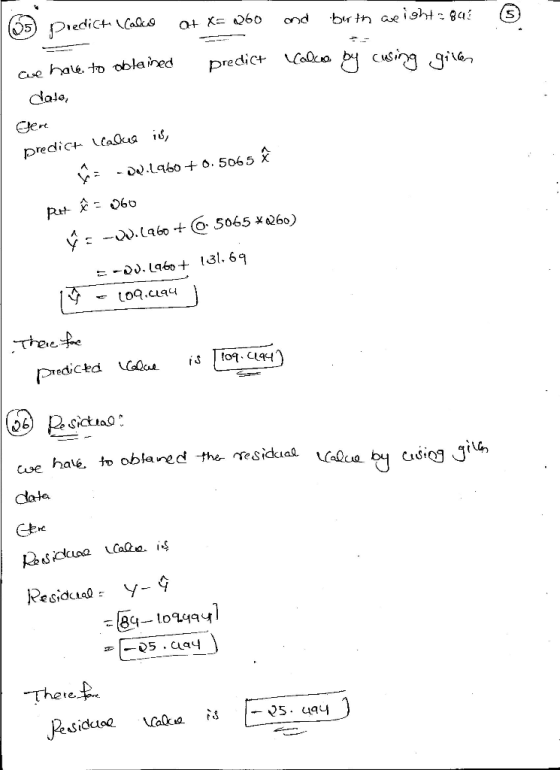
For Questions 24-26: Baby Birth Weight The Child Health and Devellopment Studies considered pregnancies among women in the San Francisco East Bay area. Rescarchers took a random sample of 100 pregnancies and used statistical software to construct a linear regression model to predict a baby's birth weight in ounces from the length of gestation (the number of days the mother was pregnant). A portion of the computer output is shown below. Coefficients: Prt 0.479 1.93e-05 Estimate 22.1960 0,5065 Std. Eror 31.2559 0.1127 t-value 0.710 4.492 (Intercept) gestation Residual standard eror: 16.93 on 98 degrees of freedom Multiple R-squared: 0.1708, Adjusted R-squared: 0.1623 24. What is the correlation between x gestation length and y birth weight? C) 0.0292 A) 0.1708 B) 16.93 E)-0.4133 D) 0.4133 A baby in the data set had a gestation length of 260 and a birth weight of 84 ounces. Compute the weight of the baby predicted by the model along with its corresponding residual. 25. Predicted value is 26. Residual is
Homework Answers


As HOMEWORKLIB RULES rule , i will answer 3 separate questions only .
please send the reaming question separately , i will answer it .
thank you!
Add Answer to:
the questions for the table for number 14 was added
For questions 13-16: Light exposure in...
For questions 13-16: Light exposure in mice Studies show that night-time light exposure is hamful to...
 For questions 13-16: Light exposure in mice Studies show that night-time light exposure is hamful to human health. A recent 6-week study randomly assigned lab mice to one of three conditions: LD (Group 1) had a standard light/dark cycle cach 24-hour period; (Group 2) LL had bright light all the time, and (Group 3) DM had dim light when there nomally would have been darkness. The rescarchers hoped to investigate how light exposure interacts with eating and sleeping cycles and...
DATA 4.1 Does Light at Night Affect Weight Gain? Numerous studies have shown that exposure to lig...
 DATA 4.1 Does Light at Night Affect Weight Gain? Numerous studies have shown that exposure to light at night is harmful to human health. A recent study? examines the effect of light at night on body mass gain in mice. Eighteen mice were randomly assigned to one of two groups: the Dark group had a normal light/dark cycle with darkness at night and the Light group had a dim light on at night, equivalent to having a television set on...
Chapter 8, Section 1, Exercise 033 LIGHT AT NIGHT MAKES FAT MICE Studies have shown that...
Chapter 8, Section 1, Exercise 033 LIGHT AT NIGHT MAKES FAT MICE Studies have shown that exposure to light at night is harmful to human health. A study in mice shows that light at night has an effect on weight gain after just three weeks. In the study, mice were randomly assigned to live in one of three light conditions: LD had a standard light/dark cycle, LL had bright light all the time, and DM had dim light when there...
The table below shows the price per gallon (in dollars) for a random sample of exterior...
 The table below shows the price per gallon (in dollars) for a random sample of exterior deck treatments. At a = 0.05, can you reject the claim that the mean price is the same for the three types of treatments? Perform a one-way ANOVA test by completing parts a through d. Assume that each sample is drawn from a normal population, the samples are independent of each other, and the populations have the same variances. 1 8 25 Semitransparent treatments...
3. The table to the right shows the cost per ounce (in dollars) for a random...
 3. The table to the right shows the cost per ounce (in dollars) for a random sample of toothpastes exhibiting very good stain removal, goad stain removal, and fair stain removal. At α= 0.01, can you conclude that the mean costs per ounce are different? Perform a one-way ANOVA test by completing parts a through d. Assume that each sample is drawn from a normal population, that the samples are independent of each other, and that the populations have the...
Chicken diet and weight. In previous chapter, we compared the effects of two types of feed...
 Chicken diet and weight. In previous chapter, we compared the effects of two types of feed at a time. A better analysis would first consider all feed types at once: casein, horsebean, linseed, meat meal, soybean, and sunflower. The ANOVA output below can be used to test for differences between the average weights of chicks on different diets. DF Sum Sa Mean Sq F value Pr(>F) feed 5 231129.16 46225.83 15.36 0.0000 residuals 65195556.02 3008.55 Conduct a hypothesis test to...
Q7) A hypothesis test is to be performed with a Null hypothesis and an alternative hypothesis , the...
Q7) A hypothesis test is to be performed with a Null hypothesis and an alternative hypothesis , the population standard deviation is σ=3.0, the sample size is 30, and the significance level is α=0.025. What is a type I error? (1 mark) What is the chance of making a type I error in the above test? (1 mark) What is a Type II error? (1 mark) What value would the sample mean have to be greater than to reject Ho? (2 marks) It is...
The authors of a paper titled "Age and Violent Content Labels Make Video Games Forbidden Fruits f...
 The authors of a paper titled "Age and Violent Content Labels
Make Video Games Forbidden Fruits for Youth" carried out an
experiment to determine if restrictive labels on video games
actually increased the attractiveness of the game for young game
players.
Participants read a description of a new video game and were asked
how much they wanted to play the game. The description also
included an age rating. Some participants read the description with
an age restrictive label of 7+,...
The authors of a paper titled "Age and Violent Content Labels
Make Video Games Forbidden Fruits for Youth" carried out an
experiment to determine if restrictive labels on video games
actually increased the attractiveness of the game for young game
players.
Participants read a description of a new video game and were asked
how much they wanted to play the game. The description also
included an age rating. Some participants read the description with
an age restrictive label of 7+,...
14. Select the number of participants in the Beck & Watson study Group of answer choices...
 14. Select the number of participants in the Beck & Watson
study
Group of answer choices
8
13
22
35
15. Beck & Watson determined their final sample size via
Group of answer choices
coding
saturation
triangulation
ethnography
16.Through their study, Beck & Watson determined
Group of answer choices
after a traumatic birth, subsequent births have no troubling
effects
after a traumatic birth, subsequent births brought fear, terror,
anxiety, and dread
Subsequent Childbirth After a Previous Traumatic Birth Beck, Cheryl...
14. Select the number of participants in the Beck & Watson
study
Group of answer choices
8
13
22
35
15. Beck & Watson determined their final sample size via
Group of answer choices
coding
saturation
triangulation
ethnography
16.Through their study, Beck & Watson determined
Group of answer choices
after a traumatic birth, subsequent births have no troubling
effects
after a traumatic birth, subsequent births brought fear, terror,
anxiety, and dread
Subsequent Childbirth After a Previous Traumatic Birth Beck, Cheryl...
Name: Section Number To be graded assignments must be completed and submitted on the original book...
 Name: Section Number To be graded assignments must be completed and submitted on the original book page Hypothesis Testing -As a Diagnostic Test ? Answer the following questions over the content material you just read or watched. 1. What is a false positive rate in the context of hypothesis testing? 2. What is the goal of hypothesis testing? 3. What is a Type I error, and how is it related to an "alpha level?" 4. What does it mean to...
 For questions 13-16: Light exposure in mice Studies show that night-time light exposure is hamful to human health. A recent 6-week study randomly assigned lab mice to one of three conditions: LD (Group 1) had a standard light/dark cycle cach 24-hour period; (Group 2) LL had bright light all the time, and (Group 3) DM had dim light when there nomally would have been darkness. The rescarchers hoped to investigate how light exposure interacts with eating and sleeping cycles and...
 DATA 4.1 Does Light at Night Affect Weight Gain? Numerous studies have shown that exposure to light at night is harmful to human health. A recent study? examines the effect of light at night on body mass gain in mice. Eighteen mice were randomly assigned to one of two groups: the Dark group had a normal light/dark cycle with darkness at night and the Light group had a dim light on at night, equivalent to having a television set on...
 The table below shows the price per gallon (in dollars) for a random sample of exterior deck treatments. At a = 0.05, can you reject the claim that the mean price is the same for the three types of treatments? Perform a one-way ANOVA test by completing parts a through d. Assume that each sample is drawn from a normal population, the samples are independent of each other, and the populations have the same variances. 1 8 25 Semitransparent treatments...
 3. The table to the right shows the cost per ounce (in dollars) for a random sample of toothpastes exhibiting very good stain removal, goad stain removal, and fair stain removal. At α= 0.01, can you conclude that the mean costs per ounce are different? Perform a one-way ANOVA test by completing parts a through d. Assume that each sample is drawn from a normal population, that the samples are independent of each other, and that the populations have the...
 Chicken diet and weight. In previous chapter, we compared the effects of two types of feed at a time. A better analysis would first consider all feed types at once: casein, horsebean, linseed, meat meal, soybean, and sunflower. The ANOVA output below can be used to test for differences between the average weights of chicks on different diets. DF Sum Sa Mean Sq F value Pr(>F) feed 5 231129.16 46225.83 15.36 0.0000 residuals 65195556.02 3008.55 Conduct a hypothesis test to...
 The authors of a paper titled "Age and Violent Content Labels
Make Video Games Forbidden Fruits for Youth" carried out an
experiment to determine if restrictive labels on video games
actually increased the attractiveness of the game for young game
players.
Participants read a description of a new video game and were asked
how much they wanted to play the game. The description also
included an age rating. Some participants read the description with
an age restrictive label of 7+,...
The authors of a paper titled "Age and Violent Content Labels
Make Video Games Forbidden Fruits for Youth" carried out an
experiment to determine if restrictive labels on video games
actually increased the attractiveness of the game for young game
players.
Participants read a description of a new video game and were asked
how much they wanted to play the game. The description also
included an age rating. Some participants read the description with
an age restrictive label of 7+,...
 14. Select the number of participants in the Beck & Watson
study
Group of answer choices
8
13
22
35
15. Beck & Watson determined their final sample size via
Group of answer choices
coding
saturation
triangulation
ethnography
16.Through their study, Beck & Watson determined
Group of answer choices
after a traumatic birth, subsequent births have no troubling
effects
after a traumatic birth, subsequent births brought fear, terror,
anxiety, and dread
Subsequent Childbirth After a Previous Traumatic Birth Beck, Cheryl...
14. Select the number of participants in the Beck & Watson
study
Group of answer choices
8
13
22
35
15. Beck & Watson determined their final sample size via
Group of answer choices
coding
saturation
triangulation
ethnography
16.Through their study, Beck & Watson determined
Group of answer choices
after a traumatic birth, subsequent births have no troubling
effects
after a traumatic birth, subsequent births brought fear, terror,
anxiety, and dread
Subsequent Childbirth After a Previous Traumatic Birth Beck, Cheryl...
 Name: Section Number To be graded assignments must be completed and submitted on the original book page Hypothesis Testing -As a Diagnostic Test ? Answer the following questions over the content material you just read or watched. 1. What is a false positive rate in the context of hypothesis testing? 2. What is the goal of hypothesis testing? 3. What is a Type I error, and how is it related to an "alpha level?" 4. What does it mean to...
Most questions answered within 3 hours.
-
Create a balanced compensation plan that you feel would
encourage a restaurant manager to be more...
asked 29 seconds from now -
Re: Human Physiology
Comment on the differences between representing V02 max as an
absolute number and...
asked 2 minutes ago -
A firm with a WACC of 10% is considering the following mutually
exclusive projects:
0
1...
asked 6 minutes ago -
. A 100.0 mL sample of 0.18 M HClO4 is titrated with 0.27 M
LiOH. Determine...
asked 29 minutes ago -
A regression equation that describes the relationship between
the amount of the bill ($) at a...
asked 1 hour ago -
exercise on VSEPR and molecular structrue.
octahedral
SeCl62-
TeCl62-
ClF62-
distorted
SeF62–
IF6–
asked 1 hour ago -
284 mL of a 0.52 M potassium hydroxide solution is added to 467
mL of a...
asked 1 hour ago -
Little’s Law: Val d’Costa is a world famous ski village in the
French Alps. Because of...
asked 2 hours ago -
Find the absolute error D for the calculation if A + B/C=D A=
9.4 +/- 0.4...
asked 3 hours ago -
New Air Heating and Cooling, manufactures furnaces and central
air units. The company pride itself on...
asked 3 hours ago -
A coach uses a new technique to train gymnasts. Seven
gymnasts were randomly selected and their...
asked 5 hours ago -
While rotating the tires on your car you notice a rock [mass =
0.1 Kg] stuck...
asked 7 hours ago