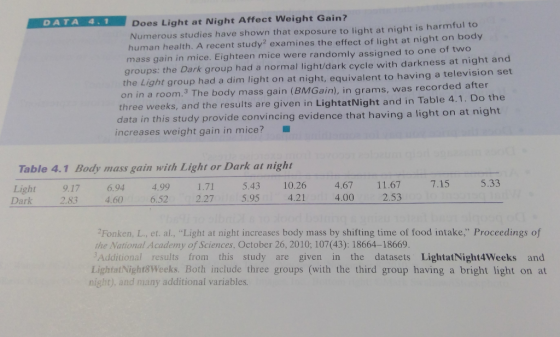
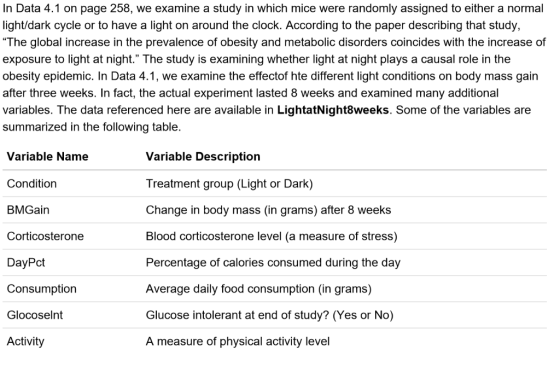


In Data 4.1 on page 258, we examine a study in which mice were randomly assigned to either a normal light/dark cycle or to have a light on around the clock. According to the paper describing that study, "The global increase in the prevalence of obesity and metabolic disorders coincides with the increase of exposure to light at night." The study is examining whether light at night plays a causal role in the obesity epidemic. In Data 4.1, we examine the effectof hte different light conditions on body mass gain after three weeks. In fact, the actual experiment lasted 8 weeks and examined many additional variables. The data referenced here are available in LightatNight8weeks. Some of the variables are summarized in the following table. Variable Name Condition BMGain Corticosterone DayPct Variable Description Treatment group (Light or Dark) Change in body mass (in grams) after 8 weeks Blood corticosterone level (a measure of stress) Percentage of calories consumed during the day Average daily food consumption (in grams) Glucose intolerant at end of study? (Yes or No) A measure of physical activity level Consumption Glocoselnt Activity
1. What are the cases? What is the explanatory variable? Is this a randomized experiment or an observational study? 2. What is the mean body mass gain for all the mice in this dataset? What is the five number summary? Show a graph of the body mass gains in the sample. Do there appear to be any outliers? Find and interpret a 95% confidence interval for mean body mass gain.
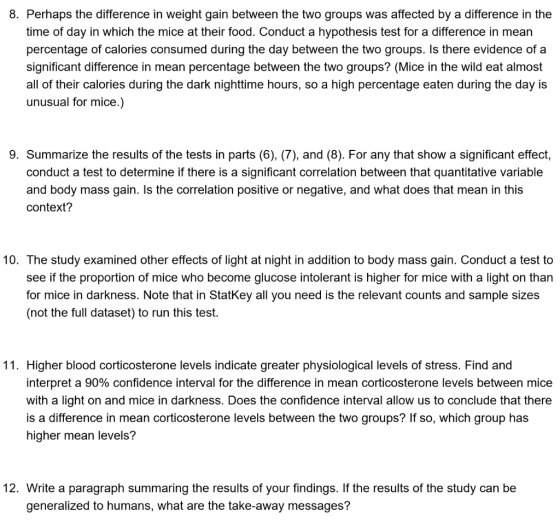
3. The primary question in the study was whether having a light on at night causes greater average body mass gain. Give side-by-side boxplots comparing body mass gain for the two groups. Does having a light on at night appear to increase body mass gain in mice?
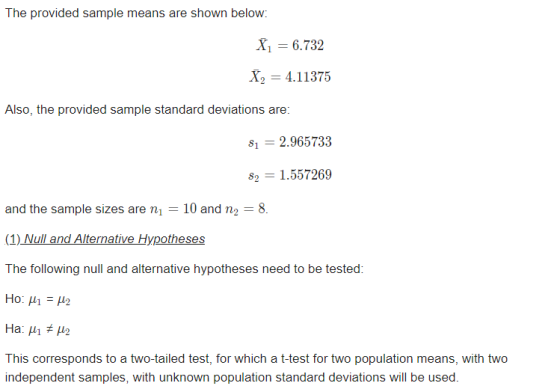
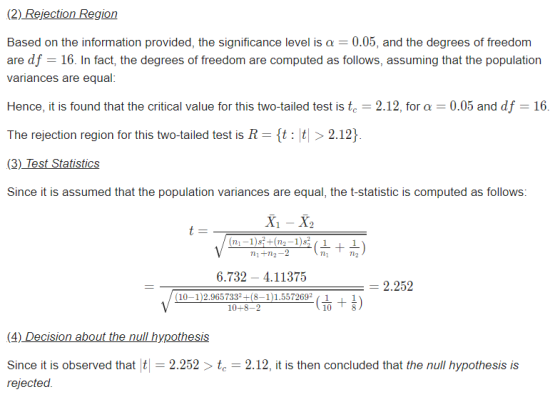
4. Conduct a hypothesis test to see if the data provide evidence that mean body mass gain is higher for mice with a light on at night. Show all details of the test. If the results are significant, can we conclude that there is a causal association? Why or why not?
5. To examine how large is the effect on body mass gain of having a light on at night, give a 99% confidence interval for the difference in mean body mass gain between mice with a light on at night and mice with darkness at night. Interpret the interval in context. 6. Perhaps the difference in weight gain between the two groups was affected by a difference in food consumption. Conduct a hypothesis test for a difference in mean consumption between the two groups. Is there evidence of a significant difference in average food consumption betweern the two groups? 7. Perhaps the difference in weight gain between the two groups was affected by a difference in activity level. Conduct a hypothesis test for a difference in mean activity level between the two groups. Is there evidence of a significant difference in average activity level between the two groups?
8. Perhaps the difference in weight gain between the two groups was affected by a difference in the time of day in which the mice at their food. Conduct a hypothesis test for a difference in mean percentage of calories consumed during the day between the two groups. Is there evidence of a significant difference in mean percentage between the two groups? (Mice in the wild eat almost all of their calories during the dark nighttime hours, so a high percentage eaten during the day is unusual for mice.) 9. Summarize the results of the tests in parts (6), (7), and (8). For any that show a significant effect, conduct a test to determine if there is a significant correlation between that quantitative variable and body mass gain. Is the correlation positive or negative, and what does that mean in this context? 10. The study examined other effects of light at night in addition to body mass gain. Conduct a test to see if the proportion of mice who become glucose intolerant is higher for mice with a light on than mice in darkness. Note that in StatKey all you need is the relevant counts and sample sizes (not the full dataset) to run this test. 11. Higher blood corticosterone levels indicate greater physiological levels of stress. Find and interpret a 90% confidence interval for the difference in mean corticosterone levels between mice with a light on and mice in darkness. Does the confidence interval allow us to conclude that theree is a difference in mean corticosterone levels between the two groups? If so, which group has higher mean levels? 12. Write a paragraph summaring the results of your findings. If the results of the study can be generalized to humans, what are the take-away messages?
Homework Answers
1)There are two cases Dark and Light. These two are predictor variables and BMI is the explanatory variable. It's a randomized experiment as we are doing an experiment on mice using an input variable which is the presence of light or not.
4)
> mean(light)
[1] 6.732
> mean(dark)
[1] 4.11375
> sd(light)
[1] 2.965733
> sd(dark)
> length(light)
[1] 10
> length(dark)
[1] 8

Add Answer to:
DATA 4.1 Does Light at Night Affect Weight Gain? Numerous studies have shown that exposure to lig...
In Data 4.1 on page 258, we examine a study in which mice were randomly assigned to either a norm...
 In Data 4.1 on page 258, we examine a study in which mice were randomly assigned to either a normal light/dark cycle or to have a light on around the clock. According to the paper describing that study, "The global increase in the prevalence of obesity and metabolic disorders coincides with the increase of exposure to light at night." The study is examining whether light at night plays a causal role in the obesity epidemic. In Data 4.1, we examine...
For questions 13-16: Light exposure in mice Studies show that night-time light exposure is hamful to...
 For questions 13-16: Light exposure in mice Studies show that night-time light exposure is hamful to human health. A recent 6-week study randomly assigned lab mice to one of three conditions: LD (Group 1) had a standard light/dark cycle cach 24-hour period; (Group 2) LL had bright light all the time, and (Group 3) DM had dim light when there nomally would have been darkness. The rescarchers hoped to investigate how light exposure interacts with eating and sleeping cycles and...
Chapter 8, Section 1, Exercise 033 LIGHT AT NIGHT MAKES FAT MICE Studies have shown that...
Chapter 8, Section 1, Exercise 033 LIGHT AT NIGHT MAKES FAT MICE Studies have shown that exposure to light at night is harmful to human health. A study in mice shows that light at night has an effect on weight gain after just three weeks. In the study, mice were randomly assigned to live in one of three light conditions: LD had a standard light/dark cycle, LL had bright light all the time, and DM had dim light when there...
In addition to monitoring weight gain, food consumed, and activity level, the study measured stress levels...
In addition to monitoring weight gain, food consumed, and activity level, the study measured stress levels in the mice by measuring corticosterone levels in the blood (higher levels indicate more stress.) Conditions for ANOVA are met and computer output for corticosterone levels for each of the three light conditions is shown. Level N Mean StDev DM LD LL 10 73.40 67.49 8 70.02 54.15 9 50.83 42.22 One-way ANOVA: Corticosterone versus Light SourceDF SS MS F P Light 2 2713...
Hypothesis test
Perhaps the difference in weight gain between the two groups was affected by a difference in food consumption. Conduct a hypothesis test for a difference in mean consumption between the two groups. Is there evidence of a significant difference in average food consumption betweern the two groups?
You are testing the claim that having lights on at night increases weight gain (abstract). A...
 You are testing the claim that having lights on at night increases weight gain (abstract). A sample of 10 mice lived in an environment with bright light on all of the time and 8 mice who lived in an environment with a normal light/dark cycle is given below. Test the claim using a 6% level of significance. Assume the population variances are unequal and that the weight changes are normally distributed. Give answers to 3 decimal places. Data available at...
the questions for the table for number 14 was added For questions 13-16: Light exposure in...
 the questions for the table for number 14 was added
For questions 13-16: Light exposure in mice Studies show that night-time light exposure is hamful to human health. A recent 6-week study randomly assigned lab mice to one of three conditions: LD (Group 1) had a standard light/dark cycle cach 24-hour period; (Group 2) LL had bright light all the time, and (Group 3) DM had dim light when there nomally would have been darkness. The rescarchers hoped to investigate...
the questions for the table for number 14 was added
For questions 13-16: Light exposure in mice Studies show that night-time light exposure is hamful to human health. A recent 6-week study randomly assigned lab mice to one of three conditions: LD (Group 1) had a standard light/dark cycle cach 24-hour period; (Group 2) LL had bright light all the time, and (Group 3) DM had dim light when there nomally would have been darkness. The rescarchers hoped to investigate...
(5 points) Weight gain during pregnancy. In 2004, the state of North Carolina released to the...
 (5 points) Weight gain during pregnancy. In 2004, the state of North Carolina released to the public a large data set containing information on births recorded in this state. This data set has been of interest to medical researchers who are studying the relationship between habits and practices of expectant mothers and the birth of their children. The following histograms show the distributions of weight gain during pregnancy by 840 younger moms (less than 35 years old) and 128 mature...
16 points) Weight gain during pregnancy. In 2004, the state of North Carolina released to the...
 16 points) Weight gain during pregnancy. In 2004, the state of North Carolina released to the public a large data set containing information on births recorded in this state. This data set has been of interest to medical researchers who are studying the relationship between habits and practices of expectant mothers and the birth of their children. The following histograms show the distributions of weight gain during pregnancy by 844 younger moms (less than 35 years old) and 135 mature...
6. A two-tailed hypothesis test for a repeated-measures research design Previous studies have shown that playing...
 6. A two-tailed hypothesis test for a repeated-measures research design Previous studies have shown that playing video games can increase visual perception abilities on tasks presented in the gaming zone of the screen (within 5 degrees of the center). A graduate student is interested in whether playing video games increases peripheral visual perception abilities or decreases attention to peripheral regions because of focus on the gaming zone. For his study, he selects a random sample of 81 adults. The subjects...
 In Data 4.1 on page 258, we examine a study in which mice were randomly assigned to either a normal light/dark cycle or to have a light on around the clock. According to the paper describing that study, "The global increase in the prevalence of obesity and metabolic disorders coincides with the increase of exposure to light at night." The study is examining whether light at night plays a causal role in the obesity epidemic. In Data 4.1, we examine...
 For questions 13-16: Light exposure in mice Studies show that night-time light exposure is hamful to human health. A recent 6-week study randomly assigned lab mice to one of three conditions: LD (Group 1) had a standard light/dark cycle cach 24-hour period; (Group 2) LL had bright light all the time, and (Group 3) DM had dim light when there nomally would have been darkness. The rescarchers hoped to investigate how light exposure interacts with eating and sleeping cycles and...
 You are testing the claim that having lights on at night increases weight gain (abstract). A sample of 10 mice lived in an environment with bright light on all of the time and 8 mice who lived in an environment with a normal light/dark cycle is given below. Test the claim using a 6% level of significance. Assume the population variances are unequal and that the weight changes are normally distributed. Give answers to 3 decimal places. Data available at...
 the questions for the table for number 14 was added
For questions 13-16: Light exposure in mice Studies show that night-time light exposure is hamful to human health. A recent 6-week study randomly assigned lab mice to one of three conditions: LD (Group 1) had a standard light/dark cycle cach 24-hour period; (Group 2) LL had bright light all the time, and (Group 3) DM had dim light when there nomally would have been darkness. The rescarchers hoped to investigate...
the questions for the table for number 14 was added
For questions 13-16: Light exposure in mice Studies show that night-time light exposure is hamful to human health. A recent 6-week study randomly assigned lab mice to one of three conditions: LD (Group 1) had a standard light/dark cycle cach 24-hour period; (Group 2) LL had bright light all the time, and (Group 3) DM had dim light when there nomally would have been darkness. The rescarchers hoped to investigate...
 (5 points) Weight gain during pregnancy. In 2004, the state of North Carolina released to the public a large data set containing information on births recorded in this state. This data set has been of interest to medical researchers who are studying the relationship between habits and practices of expectant mothers and the birth of their children. The following histograms show the distributions of weight gain during pregnancy by 840 younger moms (less than 35 years old) and 128 mature...
 16 points) Weight gain during pregnancy. In 2004, the state of North Carolina released to the public a large data set containing information on births recorded in this state. This data set has been of interest to medical researchers who are studying the relationship between habits and practices of expectant mothers and the birth of their children. The following histograms show the distributions of weight gain during pregnancy by 844 younger moms (less than 35 years old) and 135 mature...
 6. A two-tailed hypothesis test for a repeated-measures research design Previous studies have shown that playing video games can increase visual perception abilities on tasks presented in the gaming zone of the screen (within 5 degrees of the center). A graduate student is interested in whether playing video games increases peripheral visual perception abilities or decreases attention to peripheral regions because of focus on the gaming zone. For his study, he selects a random sample of 81 adults. The subjects...
Most questions answered within 3 hours.
-
Use case analysis is used to ____
a) communicate system requirements
b) implement the system
c)...
asked 1 minute ago -
Planets X, Y, and Z have circular orbits around a Star, which is
similar to our...
asked 3 minutes ago -
What is the equilibrium constant for the reaction below, given
the listed concentrations at equilibrium? Report...
asked 4 minutes ago -
The following account appears in the ledger prior to recognizing
the jobs completed in August:
Work...
asked 5 minutes ago -
Air contained in a piston-cylinder undergoes two processes in
series. In the first the air expands...
asked 10 minutes ago -
Propose a circuit that has an effective resistance of 6666ohms.
Include drawing.
asked 19 minutes ago -
Starting with a given fatty acid: C22:6 w-3 go through the
process of beta oxidation. begin...
asked 19 minutes ago -
The membrane filter technique was used to test a polluted water
for the coliform group. Three...
asked 26 minutes ago -
I have a node.h and node.cpp file. The goal is to combine the
code using a...
asked 25 minutes ago -
1a
Your cell suspension is 6.3 x 10^8 cells /mL. Explain how to
prepare a tube...
asked 32 minutes ago -
A
total of 120 different numbers formed by multiplying some or all of
numbers 2, 3,...
asked 55 minutes ago -
On your wedding day you leave for the church 28.0 minutes before
the ceremony is to...
asked 1 hour ago