


![## [1] 8.617647 The mean increase in body mass is 8.618 grams. The five number summary is: ## 0% 25% 50% 75% 100% ## 2.79 6.3](http://img.homeworklib.com/images/e61d60ec-4eb8-4da1-858b-e6d7a6bb41e3.png?x-oss-process=image/resize,w_560)


1. What are the cases? What is the explanatory variable? Is this a randomized experiment or an observational study? 2. What is the mean body mass gain for all the mice in this dataset? What is the five number summary? Show a graph of the body mass gains in the sample. Do there appear to be any outliers? Find and interpret a 95% confidence interval for mean body mass gain.
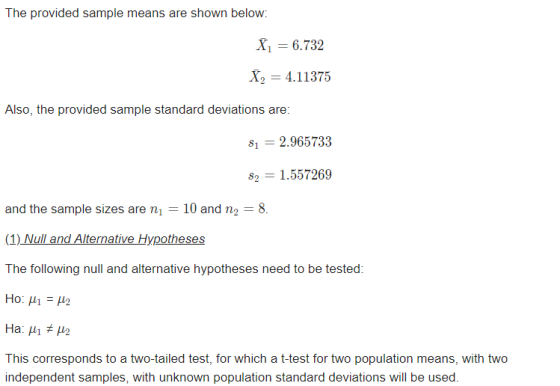
## [1] 8.617647 The mean increase in body mass is 8.618 grams. The five number summary is: ## 0% 25% 50% 75% 100% ## 2.79 6.34 9.05 9.89 17.40 5- 4 2 0- 10 BMGain 5 15 To find a 95% confidence interval, we need to use the bootstrap method
500 400 300- 200 100- 10 12 Bootstrap sample Body Mass Gains (in grams) Since this distribution is relatively symmetric and bell-shaped, we can use the 95% rule
Since this distribution is relatively symmetric and bell-shaped, we can use the 95% rule. ## BOOTSTRAP CONFIDENCE INTERVAL CALCULATIONS ## Based on 10000 bootstrap replicates ## CALL : ## boot.ci(boot.out gains-boot, type "basic") = _ ## Intervals : ## Level ## 95% ( 7.012, 1.151 ) ## Calculations and Intervals on Original Scale Basic 3. The primary question in the study was whether having a light on at night causes greater average body mass gain. Give side-by-side boxplots comparing body mass gain for the two groups. Does having a light on at night appear to increase body mass gain in mice?
Light- Dark 15 10 BMGain 4. Conduct a hypothesis test to see if the data provide evidence that mean body mass gain is higher for mice with a light on at night. Show all details of the test. If the results are significant, can we conclude that there is a causal association? Why or why not?
5. To examine how large is the effect on body mass gain of having a light on at night, give a 99% confidence interval for the difference in mean body mass gain between mice with a light on at night and mice with darkness at night. Interpret the interval in context. 6. Perhaps the difference in weight gain between the two groups was affected by a difference in food consumption. Conduct a hypothesis test for a difference in mean consumption between the two groups. Is there evidence of a significant difference in average food consumption betweern the two groups? 7. Perhaps the difference in weight gain between the two groups was affected by a difference in activity level. Conduct a hypothesis test for a difference in mean activity level between the two groups. Is there evidence of a significant difference in average activity level between the two groups?
8. Perhaps the difference in weight gain between the two groups was affected by a difference in the time of day in which the mice at their food. Conduct a hypothesis test for a difference in mean percentage of calories consumed during the day between the two groups. Is there evidence of a significant difference in mean percentage between the two groups? (Mice in the wild eat almost all of their calories during the dark nighttime hours, so a high percentage eaten during the day is unusual for mice.) 9. Summarize the results of the tests in parts (6), (7), and (8). For any that show a significant effect, conduct a test to determine if there is a significant correlation between that quantitative variable and body mass gain. Is the correlation positive or negative, and what does that mean in this context? 10. The study examined other effects of light at night in addition to body mass gain. Conduct a test to see if the proportion of mice who become glucose intolerant is higher for mice with a light on than mice in darkness. Note that in StatKey all you need is the relevant counts and sample sizes (not the full dataset) to run this test. 11. Higher blood corticosterone levels indicate greater physiological levels of stress. Find and interpret a 90% confidence interval for the difference in mean corticosterone levels between mice with a light on and mice in darkness. Does the confidence interval allow us to conclude that theree is a difference in mean corticosterone levels between the two groups? If so, which group has higher mean levels? 12. Write a paragraph summaring the results of your findings. If the results of the study can be generalized to humans, what are the take-away messages?
Homework Answers
1)There are two cases Dark and Light. These two are predictor variables and BMI is the explanatory variable. It's a randomized experiment as we are doing an experiment on mice using an input variable which is the presence of light or not.

4)
> mean(light)
[1] 6.732
> mean(dark)
[1] 4.11375
> sd(light)
[1] 2.965733
> sd(dark)
> length(light)
[1] 10
> length(dark)
[1] 8


Add Answer to:
In Data 4.1 on page 258, we examine a study in which mice were randomly assigned to either a norm...
DATA 4.1 Does Light at Night Affect Weight Gain? Numerous studies have shown that exposure to lig...
 DATA 4.1 Does Light at Night Affect Weight Gain? Numerous studies have shown that exposure to light at night is harmful to human health. A recent study? examines the effect of light at night on body mass gain in mice. Eighteen mice were randomly assigned to one of two groups: the Dark group had a normal light/dark cycle with darkness at night and the Light group had a dim light on at night, equivalent to having a television set on...
For questions 13-16: Light exposure in mice Studies show that night-time light exposure is hamful to...
 For questions 13-16: Light exposure in mice Studies show that night-time light exposure is hamful to human health. A recent 6-week study randomly assigned lab mice to one of three conditions: LD (Group 1) had a standard light/dark cycle cach 24-hour period; (Group 2) LL had bright light all the time, and (Group 3) DM had dim light when there nomally would have been darkness. The rescarchers hoped to investigate how light exposure interacts with eating and sleeping cycles and...
In addition to monitoring weight gain, food consumed, and activity level, the study measured stress levels...
In addition to monitoring weight gain, food consumed, and activity level, the study measured stress levels in the mice by measuring corticosterone levels in the blood (higher levels indicate more stress.) Conditions for ANOVA are met and computer output for corticosterone levels for each of the three light conditions is shown. Level N Mean StDev DM LD LL 10 73.40 67.49 8 70.02 54.15 9 50.83 42.22 One-way ANOVA: Corticosterone versus Light SourceDF SS MS F P Light 2 2713...
Chapter 8, Section 1, Exercise 033 LIGHT AT NIGHT MAKES FAT MICE Studies have shown that...
Chapter 8, Section 1, Exercise 033 LIGHT AT NIGHT MAKES FAT MICE Studies have shown that exposure to light at night is harmful to human health. A study in mice shows that light at night has an effect on weight gain after just three weeks. In the study, mice were randomly assigned to live in one of three light conditions: LD had a standard light/dark cycle, LL had bright light all the time, and DM had dim light when there...
Two researchers conducted a study in which two groups of students were asked to answer 42...
 Two researchers conducted a study in which two groups of students were asked to answer 42 trivia questions from a board game. The students in group 1 were asked to spend 5 minutes thinking about what it would mean to be a professor, while the students in group 2 were asked to think about soccer hooligans. These pretest thoughts are a form of priming. The 200 students in group 1 had a mean score of 21.4 with a standard deviation...
In this study, participants were randomly assigned to one of two groups – to watch either...
In this study, participants were randomly assigned to one of two groups – to watch either a NEUTRAL or EMOTIONAL movie clip. After watching for an hour, participants were asked to rate work place satisfaction using an inventory that ranges from 0 – 10 (with higher indicating higher satisfaction). Assume data meets all assumptions for a parametric test. Using the information provided, create an SPSS data file and conduct the appropriate statistical test to determine whether there is a statistically...
Problem 3: A study examines chocolate's effects on blood vessel function in healthy people. In the...
 Problem 3: A study examines chocolate's effects on blood vessel function in healthy people. In the randomized, double-blind, placebo-controlled study, 11 people received 46 grams (1.6 ounces) of dark chocolate (which is naturally flavonoid-rich) every day for two weeks, while a control group of 10 people received a placebo consisting of dark chocolate with low flavonoid content. Participants had their vascular health measured (by means of flow-mediated dilation) before and after the two-week study. The increase over the two-week period...
7. A study was conducted to investigate the effectiveness of a new drug for treating Stage...
7. A study was conducted to investigate the effectiveness of a new drug for treating Stage 4 AIDS patients. A group of AIDS patients was randomly divided into two groups. One group received the new drug; the other group received a placebo. The difference in mean subsequent survival (those with drugs - those without drugs) was found to be 1.04 years and a 95% confidence interval was found to be 1.04 ± 2.37 years. Based upon this information: Select one...
A statistics teacher wanted to see whether there was a significant difference in ages between day...
 A statistics teacher wanted to see whether there was a significant difference in ages between day students and night students. A random sample of 35 students is selected from each group. The data are given below. Day Students 1 22 1 29 20 20 24 18 24 20 23 24 21 23 27 26 23 21 22 17 30 19 18 22 19 25 19 23 18 25 21 20 18 21 Night Students 18 23 24 27 1925 25...
Question 5: Which statement is true: (a) A 90% confidence interval for μ is wider than...
 Question 5: Which statement is true: (a) A 90% confidence interval for μ is wider than a 95% confidence interval for μ (b) The width (Le, the length) of a confidence interval is equal to its margin of error (c) Decreasing the sample size will make the confidence wider (d) The standard deviation of the sample mean is larger than the population standard deviation o. Question 6. A test of H0 : μ-128 against Ha : μ > 12.8 has...
 DATA 4.1 Does Light at Night Affect Weight Gain? Numerous studies have shown that exposure to light at night is harmful to human health. A recent study? examines the effect of light at night on body mass gain in mice. Eighteen mice were randomly assigned to one of two groups: the Dark group had a normal light/dark cycle with darkness at night and the Light group had a dim light on at night, equivalent to having a television set on...
 For questions 13-16: Light exposure in mice Studies show that night-time light exposure is hamful to human health. A recent 6-week study randomly assigned lab mice to one of three conditions: LD (Group 1) had a standard light/dark cycle cach 24-hour period; (Group 2) LL had bright light all the time, and (Group 3) DM had dim light when there nomally would have been darkness. The rescarchers hoped to investigate how light exposure interacts with eating and sleeping cycles and...
 Two researchers conducted a study in which two groups of students were asked to answer 42 trivia questions from a board game. The students in group 1 were asked to spend 5 minutes thinking about what it would mean to be a professor, while the students in group 2 were asked to think about soccer hooligans. These pretest thoughts are a form of priming. The 200 students in group 1 had a mean score of 21.4 with a standard deviation...
 Problem 3: A study examines chocolate's effects on blood vessel function in healthy people. In the randomized, double-blind, placebo-controlled study, 11 people received 46 grams (1.6 ounces) of dark chocolate (which is naturally flavonoid-rich) every day for two weeks, while a control group of 10 people received a placebo consisting of dark chocolate with low flavonoid content. Participants had their vascular health measured (by means of flow-mediated dilation) before and after the two-week study. The increase over the two-week period...
 A statistics teacher wanted to see whether there was a significant difference in ages between day students and night students. A random sample of 35 students is selected from each group. The data are given below. Day Students 1 22 1 29 20 20 24 18 24 20 23 24 21 23 27 26 23 21 22 17 30 19 18 22 19 25 19 23 18 25 21 20 18 21 Night Students 18 23 24 27 1925 25...
 Question 5: Which statement is true: (a) A 90% confidence interval for μ is wider than a 95% confidence interval for μ (b) The width (Le, the length) of a confidence interval is equal to its margin of error (c) Decreasing the sample size will make the confidence wider (d) The standard deviation of the sample mean is larger than the population standard deviation o. Question 6. A test of H0 : μ-128 against Ha : μ > 12.8 has...
Most questions answered within 3 hours.
-
On your wedding day you leave for the church 28.0 minutes before
the ceremony is to...
asked 2 minutes ago -
1. Read the two articles below that discuss why fuel prices
fluctuate. Research two of these...
asked 1 minute ago -
Higher leverage of Jared Corporation will most likely _____
expected earnings per share. Additionally, it will...
asked 8 minutes ago -
A recent study found that the overall rate at which colleges
"capture" higher Pell grant awards...
asked 17 minutes ago -
A) If a 1552 kg car, moving at 8 m/s north, hits and
sticks to a...
asked 22 minutes ago -
When a muscle contracts it can pull, and when it stretches it
can push.
a. True...
asked 30 minutes ago -
Write a paragraph or paragraphs explaining, "What is
molecular modelling and what is it used for?
asked 44 minutes ago -
Some request lists might cause the disk scheduler to act the
same when the three different...
asked 46 minutes ago -
Theres a 3kg block placed halfway on a 10m ramp with a slope of
17 deg....
asked 55 minutes ago -
A cyclotron is used to produce a beam of high-energy deuterons
that then collide with a...
asked 1 hour ago -
If Smoking Generates External Costs, Should Smoking
Simply be Outlawed? How about Cars that Pollute?
asked 1 hour ago -
For the reaction
2H2O(g)−⇀↽−2H2(g)+O2(g)2H2O(g)↽−−⇀2H2(g)+O2(g)
the equilibrium
concentrations were found to be [H2O]=0.250 M,[H2O]=0.250 M,
[H2]=0.490 M,[H2]=0.490...
asked 1 hour ago