We use the form = a + bx for the least-squares line. In some computer printouts, the...
We use the form = a + bx for the least-squares line. In some computer printouts, the least-squares equation is not given directly. Instead, the value of the constant a is given, and the coefficient b of the explanatory or predictor variable is displayed. Sometimes a is referred to as the constant, and sometimes as the intercept. Data from Climatology Report No. 77-3 of the Department of Atmospheric Science, Colorado State University, showed the following relationship between elevation (in thousands of feet) and average number of frost-free days per year in Colorado locations.
A Minitab printout provides the following information.
| Predictor | Coef | SE Coef | T | P |
| Constant | 316.62 | 28.31 | 11.24 | 0.002 |
| Elevation | -30.462 | 3.511 | -8.79 | 0.003 |
| S = 11.8603 | R-Sq = 97.0% |
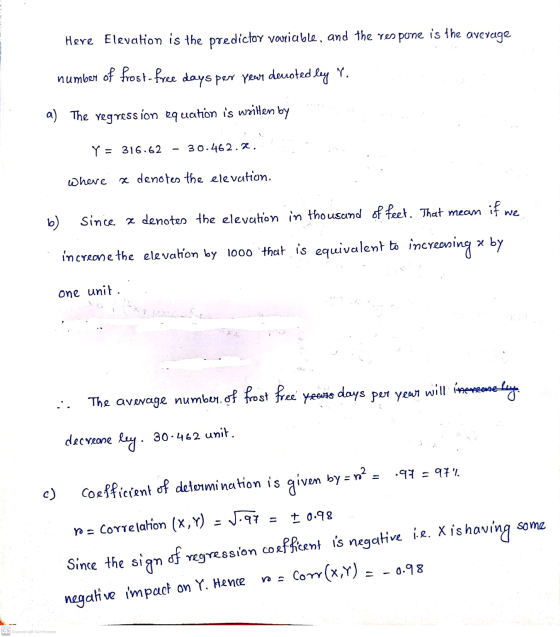
Notice that "Elevation" is listed under "Predictor." This means that elevation is the explanatory variable x. Its coefficient is the slope b. "Constant" refers to a in the equation = a + bx.
(a) Use the printout to write the least-squares equation.
| = | + x |
(b) For each 1000-foot increase in elevation, how many fewer
frost-free days are predicted? (Use 3 decimal places.)
(c) The printout gives the value of the coefficient of
determination r2. What is the value of
r? Be sure to give the correct sign for r based
on the sign of b. (Use 3 decimal places.)
Homework Answers
Add Answer to:
We use the form = a + bx for the
least-squares line. In some computer printouts, the...
We use the form y a + bx for the least-squares line. In some computer printouts, the least-square...
 we use the form y a + bx for the least-squares line. In some computer printouts, the least-squares equation is not given directly. Instead, the value of the constant a is given, and the coefficient b of the explanatory or predictor variable is displayed. Sometimes a is referred to as the constant, and sometimes as the intercept. Data from a report showed the following relationship between elevation (in thousands of feet) and average number of frost-free days per year in...
We use the form ŷ = a + bx for the least-squares line. In some computer...
We use the form ŷ = a + bx for the least-squares line. In some computer printouts, the least-squares equation is not given directly. Instead, the value of the constant a is given, and the coefficient b of the explanatory or predictor variable is displayed. Sometimes a is referred to as the constant, and sometimes as the intercept. Data from a report showed the following relationship between elevation (in thousands of feet) and average number of frost-free days per year...
u LLS FRUICHUISJ and 6 use the following information. Prehistoric pottery vessels are usually found as...
 u LLS FRUICHUISJ and 6 use the following information. Prehistoric pottery vessels are usually found as sherds (broken pieces) and are care- fully reconstructed if enough sherds can be found. Information taken from Mimbres Mogollon Archaeology by A. I. Woosley and A.J. McIntyre (University of New Mexico Press) provides data relating x = body diameter in centimeters and y = height in centimeters of prehistoric vessels reconstructed from sherds found at a prehistoric site. The following Minitab printout provides an...
Least Squares Linear Regression of Rent Predictor Variables Constant Size Coefficient 1276.56 0.16486 Std Error 454.843...
 Least Squares Linear Regression of Rent Predictor Variables Constant Size Coefficient 1276.56 0.16486 Std Error 454.843 0.41717 T 2.81 0.40 P 0.0072 0.6945 Mean Square Error (MSE) Standard Deviation 458532 677.150 R2 Adjusted R2 AICC PRESS 0.0032 -0.0175 656.27 2.34E+07 DF F 0.16 P 0.6945 1 Source Regression Residual Total MS 71610.6 458532 SS 71610.6 2.201E+07 2.208E+07 48 49 20.14 0.0006 Lack of Fit Pure Error 42 6 2.185E+07 155000 520346 25833.3 Cases Included 50 Missing Cases 0 7. Identify...
5. (2 points) When a least-squares linear regression equation is constructed based upon a data set,...
 5. (2 points) When a least-squares linear regression equation is constructed based upon a data set, and a line is constructed from this equation, which (Gif any) of the following is a. The point (F,) must be on the regression line. b. The point (0,b) must be on the regression line. c. The point (0,b) must be on the regression line. d. None of the above statements are false. All of the above statements are true. ons for ss is...
use scattergraph method, high low method, and the least square regression 247 Cost-Volume-Profit Relationships EXHIBIT SA-5...
 use
scattergraph method, high low method, and the least square
regression
247 Cost-Volume-Profit Relationships EXHIBIT SA-5 A Scattergraph Plot for Brentine Hospital Using Microsoft Excel 5:2.000 $10,000 58,000 Maintenance cost 56.000 54.000 52.000 2,000 2000 6.000 4000 Patient Day To prepare a scattergraph plot in Excel, begin by highlighting the data in cells B4 through CIO (as shown in Exhibit 5A-4). From the Charts group within the Insert tab, select the "Scatter" subgroup and then click on the choice that...
use
scattergraph method, high low method, and the least square
regression
247 Cost-Volume-Profit Relationships EXHIBIT SA-5 A Scattergraph Plot for Brentine Hospital Using Microsoft Excel 5:2.000 $10,000 58,000 Maintenance cost 56.000 54.000 52.000 2,000 2000 6.000 4000 Patient Day To prepare a scattergraph plot in Excel, begin by highlighting the data in cells B4 through CIO (as shown in Exhibit 5A-4). From the Charts group within the Insert tab, select the "Scatter" subgroup and then click on the choice that...
2. Use the data in hpricel.wfl uploaded on Moodle for this exercise. We assume that all assump- tions of the Classical Linear Model are satisfied for the model used in this question....
 2. Use the data in hpricel.wfl uploaded on Moodle for this exercise. We assume that all assump- tions of the Classical Linear Model are satisfied for the model used in this question. (a) Estimate the model and report the results in the usual form, including the standard error of the regression. Obtain the predicted price when we plug in lotsize - 10, 000, sqrft - 2,300, and bdrms- 4; round this price to the nearest dollar. (b) Run a regression...
(I did this homework in completion but professor was not happy with answers whatsoever, need additional...
 (I did this homework in completion but professor was
not happy with answers whatsoever, need additional answers and
especially improvement to 1.b
help!! photos not attaching?
mean by severai steps. inis is a View Feedback homework and will need you to work, in one two View Feedback or various steps. Unfortunately, I cannot read your screen shot of what you did on excel. As I have said in numerous messages announcements etc, I cannot аcсept pictures. You need to write...
(I did this homework in completion but professor was
not happy with answers whatsoever, need additional answers and
especially improvement to 1.b
help!! photos not attaching?
mean by severai steps. inis is a View Feedback homework and will need you to work, in one two View Feedback or various steps. Unfortunately, I cannot read your screen shot of what you did on excel. As I have said in numerous messages announcements etc, I cannot аcсept pictures. You need to write...
 we use the form y a + bx for the least-squares line. In some computer printouts, the least-squares equation is not given directly. Instead, the value of the constant a is given, and the coefficient b of the explanatory or predictor variable is displayed. Sometimes a is referred to as the constant, and sometimes as the intercept. Data from a report showed the following relationship between elevation (in thousands of feet) and average number of frost-free days per year in...
 u LLS FRUICHUISJ and 6 use the following information. Prehistoric pottery vessels are usually found as sherds (broken pieces) and are care- fully reconstructed if enough sherds can be found. Information taken from Mimbres Mogollon Archaeology by A. I. Woosley and A.J. McIntyre (University of New Mexico Press) provides data relating x = body diameter in centimeters and y = height in centimeters of prehistoric vessels reconstructed from sherds found at a prehistoric site. The following Minitab printout provides an...
 Least Squares Linear Regression of Rent Predictor Variables Constant Size Coefficient 1276.56 0.16486 Std Error 454.843 0.41717 T 2.81 0.40 P 0.0072 0.6945 Mean Square Error (MSE) Standard Deviation 458532 677.150 R2 Adjusted R2 AICC PRESS 0.0032 -0.0175 656.27 2.34E+07 DF F 0.16 P 0.6945 1 Source Regression Residual Total MS 71610.6 458532 SS 71610.6 2.201E+07 2.208E+07 48 49 20.14 0.0006 Lack of Fit Pure Error 42 6 2.185E+07 155000 520346 25833.3 Cases Included 50 Missing Cases 0 7. Identify...
 5. (2 points) When a least-squares linear regression equation is constructed based upon a data set, and a line is constructed from this equation, which (Gif any) of the following is a. The point (F,) must be on the regression line. b. The point (0,b) must be on the regression line. c. The point (0,b) must be on the regression line. d. None of the above statements are false. All of the above statements are true. ons for ss is...
 use
scattergraph method, high low method, and the least square
regression
247 Cost-Volume-Profit Relationships EXHIBIT SA-5 A Scattergraph Plot for Brentine Hospital Using Microsoft Excel 5:2.000 $10,000 58,000 Maintenance cost 56.000 54.000 52.000 2,000 2000 6.000 4000 Patient Day To prepare a scattergraph plot in Excel, begin by highlighting the data in cells B4 through CIO (as shown in Exhibit 5A-4). From the Charts group within the Insert tab, select the "Scatter" subgroup and then click on the choice that...
use
scattergraph method, high low method, and the least square
regression
247 Cost-Volume-Profit Relationships EXHIBIT SA-5 A Scattergraph Plot for Brentine Hospital Using Microsoft Excel 5:2.000 $10,000 58,000 Maintenance cost 56.000 54.000 52.000 2,000 2000 6.000 4000 Patient Day To prepare a scattergraph plot in Excel, begin by highlighting the data in cells B4 through CIO (as shown in Exhibit 5A-4). From the Charts group within the Insert tab, select the "Scatter" subgroup and then click on the choice that...
 2. Use the data in hpricel.wfl uploaded on Moodle for this exercise. We assume that all assump- tions of the Classical Linear Model are satisfied for the model used in this question. (a) Estimate the model and report the results in the usual form, including the standard error of the regression. Obtain the predicted price when we plug in lotsize - 10, 000, sqrft - 2,300, and bdrms- 4; round this price to the nearest dollar. (b) Run a regression...
 (I did this homework in completion but professor was
not happy with answers whatsoever, need additional answers and
especially improvement to 1.b
help!! photos not attaching?
mean by severai steps. inis is a View Feedback homework and will need you to work, in one two View Feedback or various steps. Unfortunately, I cannot read your screen shot of what you did on excel. As I have said in numerous messages announcements etc, I cannot аcсept pictures. You need to write...
(I did this homework in completion but professor was
not happy with answers whatsoever, need additional answers and
especially improvement to 1.b
help!! photos not attaching?
mean by severai steps. inis is a View Feedback homework and will need you to work, in one two View Feedback or various steps. Unfortunately, I cannot read your screen shot of what you did on excel. As I have said in numerous messages announcements etc, I cannot аcсept pictures. You need to write...
Most questions answered within 3 hours.
-
Complete the following probability table. (Round Prior
Probability and Posterior Probability answers to 2 decimal places...
asked 1 minute ago -
In carrying out the first standardization in an experiment, a
student used 0.5449g of potassium hydrogen...
asked 2 minutes ago -
There are n candies on the table. Alice and Bob independently
pick k random candies each....
asked 5 minutes ago -
There are 32 chocolates in a box, all identically shaped. There are
12 filled with nuts,...
asked 6 minutes ago -
Consider the following information:
State Probability Stock A Stock B Stock C
Boom 0.65 0.26 0.17...
asked 4 minutes ago -
The equilibrium constant, Kp, for the following reaction
is 0.110 at 298 K:
NH4HS(s)
->NH3(g) +...
asked 10 minutes ago -
This program should be in c++.
Rock Paper Scissors: This game is played by children and...
asked 8 minutes ago -
The Pluralist Theory holds that large groups, instead of
the electorate, actually control the democratic process...
asked 20 minutes ago -
Arduino programming
Write the syntax for the analogWrite() function in order to
output an effective 2V...
asked 27 minutes ago -
Tartaric acid is a diprotic acid we can represent as
H2T. Suppose a 100mL solution, which...
asked 27 minutes ago -
A bacteria has a doubling period of 6 days. If there are 3300
bacteria present now,...
asked 48 minutes ago -
Determine the PH of a 0.232M mg (OH)2 solution at 25 degree
Celsius.
asked 45 minutes ago